|
Download Data (XLS File) |
|
||||||||
|
||||||||
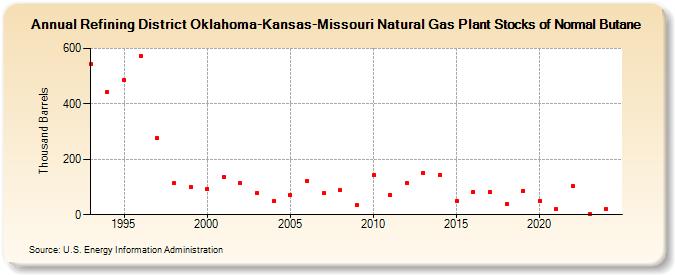
| Refining District Oklahoma-Kansas-Missouri Natural Gas Plant Stocks of Normal Butane (Thousand Barrels) | ||||||||
| Decade | Year-0 | Year-1 | Year-2 | Year-3 | Year-4 | Year-5 | Year-6 | Year-7 | Year-8 | Year-9 |
|---|---|---|---|---|---|---|---|---|---|---|
| 1990's | 542 | 444 | 486 | 573 | 275 | 113 | 100 | |||
| 2000's | 94 | 137 | 113 | 78 | 50 | 71 | 122 | 79 | 88 | 35 |
| 2010's | 142 | 72 | 114 | 151 | 144 | 50 | 82 | 82 | 40 | 87 |
| 2020's | 51 | 21 | 102 | 1 |
| - = No Data Reported; -- = Not Applicable; NA = Not Available; W = Withheld to avoid disclosure of individual company data. |
| Release Date: 6/28/2024 |
| Next Release Date: 8/30/2024 |