|
Download Data (XLS File) |
|
||||||||
|
||||||||
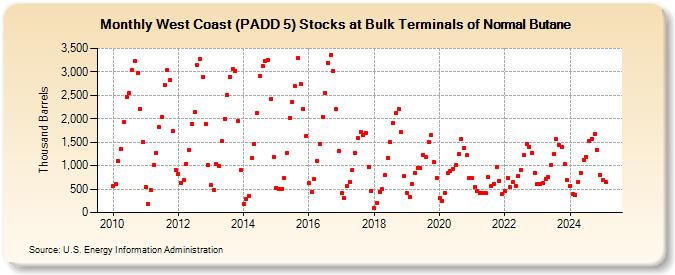
| West Coast (PADD 5) Stocks at Bulk Terminals of Normal Butane (Thousand Barrels) | ||||||||
| Year | Jan | Feb | Mar | Apr | May | Jun | Jul | Aug | Sep | Oct | Nov | Dec |
|---|---|---|---|---|---|---|---|---|---|---|---|---|
| 2009 | 847 | 572 | 771 | 781 | 786 | 1,328 | 1,670 | 2,338 | 2,748 | 2,266 | 1,472 | 1,027 |
| 2010 | 570 | 602 | 1,091 | 1,349 | 1,928 | 2,465 | 2,556 | 3,031 | 3,222 | 2,970 | 2,203 | 1,501 |
| 2011 | 535 | 178 | 473 | 1,009 | 1,276 | 1,819 | 2,040 | 2,720 | 3,044 | 2,831 | 1,744 | 914 |
| 2012 | 821 | 632 | 694 | 1,036 | 1,327 | 1,889 | 2,148 | 3,150 | 3,274 | 2,880 | 1,894 | 1,013 |
| 2013 | 581 | 490 | 1,030 | 997 | 1,526 | 2,005 | 2,511 | 2,900 | 3,059 | 3,019 | 1,958 | 906 |
| 2014 | 178 | 293 | 361 | 1,172 | 1,465 | 2,121 | 2,907 | 3,127 | 3,222 | 3,259 | 2,428 | 1,186 |
| 2015 | 523 | 511 | 512 | 727 | 1,279 | 2,019 | 2,366 | 2,688 | 3,299 | 2,745 | 2,216 | 1,627 |
| 2016 | 623 | 446 | 709 | 1,105 | 1,458 | 2,028 | 2,552 | 3,194 | 3,349 | 3,009 | 2,215 | 1,304 |
| 2017 | 411 | 305 | 567 | 659 | 913 | 1,267 | 1,600 | 1,716 | 1,656 | 1,690 | 969 | 467 |
| 2018 | 88 | 198 | 437 | 496 | 793 | 1,173 | 1,495 | 1,913 | 2,119 | 2,212 | 1,710 | 779 |
| 2019 | 415 | 342 | 609 | 851 | 953 | 953 | 1,217 | 1,195 | 1,502 | 1,664 | 1,070 | 745 |
| 2020 | 307 | 250 | 412 | 848 | 877 | 921 | 1,008 | 1,241 | 1,565 | 1,384 | 1,219 | 734 |
| 2021 | 742 | 549 | 453 | 426 | 422 | 426 | 761 | 561 | 612 | 973 | 676 | 390 |
| 2022 | 457 | 746 | 537 | 646 | 567 | 782 | 908 | 1,224 | 1,458 | 1,404 | 1,275 | 850 |
| 2023 | 606 | 614 | 624 | 721 | 749 | 1,015 | 1,239 | 1,563 | 1,627 | 1,399 | 1,026 | 688 |
| 2024 | 572 | |||||||||||
| - = No Data Reported; -- = Not Applicable; NA = Not Available; W = Withheld to avoid disclosure of individual company data. |
| Release Date: 3/29/2024 |
| Next Release Date: 4/30/2024 |