|
Download Data (XLS File) |
|
||||||||
|
||||||||
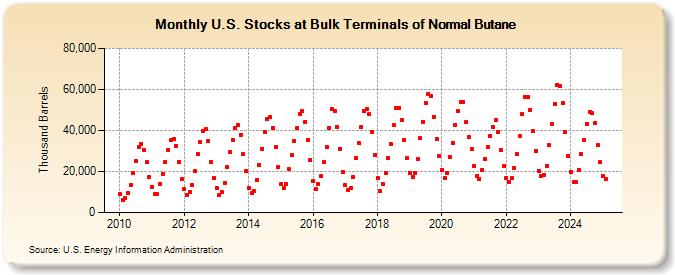
| U.S. Stocks at Bulk Terminals of Normal Butane (Thousand Barrels) | ||||||||
| Year | Jan | Feb | Mar | Apr | May | Jun | Jul | Aug | Sep | Oct | Nov | Dec |
|---|---|---|---|---|---|---|---|---|---|---|---|---|
| 2009 | 7,744 | 5,978 | 7,404 | 12,090 | 17,439 | 22,971 | 28,256 | 34,105 | 34,010 | 29,424 | 21,451 | 15,089 |
| 2010 | 8,817 | 6,109 | 6,976 | 9,671 | 13,378 | 19,389 | 25,264 | 32,136 | 33,505 | 30,722 | 24,493 | 17,146 |
| 2011 | 12,655 | 8,865 | 9,243 | 13,940 | 18,620 | 24,524 | 30,257 | 35,160 | 35,719 | 32,491 | 24,655 | 16,315 |
| 2012 | 11,400 | 8,522 | 9,939 | 13,467 | 20,340 | 28,495 | 34,537 | 39,902 | 40,757 | 34,871 | 24,695 | 16,869 |
| 2013 | 11,732 | 8,671 | 9,882 | 14,328 | 22,126 | 29,528 | 35,539 | 41,290 | 42,539 | 37,928 | 28,434 | 20,203 |
| 2014 | 12,193 | 9,311 | 10,499 | 15,782 | 23,142 | 31,130 | 39,260 | 45,633 | 46,491 | 41,009 | 32,013 | 21,968 |
| 2015 | 13,967 | 12,175 | 13,838 | 21,084 | 27,954 | 34,652 | 41,040 | 48,085 | 49,335 | 44,350 | 35,577 | 25,787 |
| 2016 | 15,192 | 11,308 | 13,726 | 17,960 | 24,724 | 32,109 | 41,216 | 50,314 | 49,251 | 41,887 | 31,187 | 19,546 |
| 2017 | 13,283 | 11,141 | 11,965 | 17,270 | 26,613 | 33,762 | 41,478 | 49,486 | 50,676 | 47,836 | 39,365 | 28,291 |
| 2018 | 16,910 | 10,359 | 14,158 | 19,259 | 26,537 | 33,192 | 42,482 | 50,835 | 51,177 | 45,112 | 35,182 | 26,374 |
| 2019 | 19,335 | 17,160 | 19,478 | 25,917 | 36,173 | 44,306 | 53,550 | 57,947 | 56,809 | 46,725 | 35,964 | 27,667 |
| 2020 | 20,856 | 16,647 | 19,284 | 26,838 | 33,985 | 42,746 | 49,380 | 53,932 | 53,871 | 44,222 | 36,610 | 30,745 |
| 2021 | 22,726 | 17,892 | 16,401 | 20,792 | 26,276 | 31,743 | 37,362 | 41,870 | 44,888 | 39,371 | 30,528 | 22,583 |
| 2022 | 16,848 | 14,870 | 16,841 | 21,652 | 28,455 | 37,313 | 47,826 | 56,214 | 56,453 | 50,179 | 39,745 | 30,061 |
| 2023 | 20,459 | 17,756 | 18,297 | 22,831 | 32,825 | 43,384 | 52,973 | 62,332 | 61,670 | 53,320 | 39,235 | 27,397 |
| 2024 | 19,842 | |||||||||||
| - = No Data Reported; -- = Not Applicable; NA = Not Available; W = Withheld to avoid disclosure of individual company data. |
| Release Date: 3/29/2024 |
| Next Release Date: 4/30/2024 |