|
Download Data (XLS File) |
|
||||||||
|
||||||||
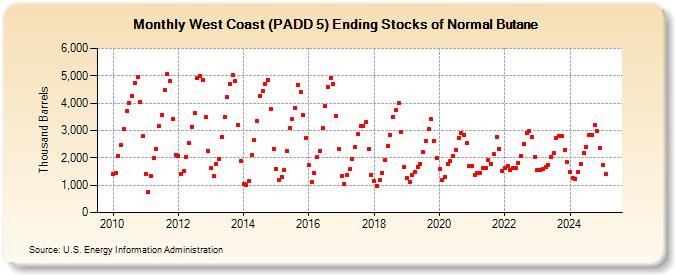
| West Coast (PADD 5) Ending Stocks of Normal Butane (Thousand Barrels) | ||||||||
| Year | Jan | Feb | Mar | Apr | May | Jun | Jul | Aug | Sep | Oct | Nov | Dec |
|---|---|---|---|---|---|---|---|---|---|---|---|---|
| 2010 | 1,413 | 1,449 | 2,072 | 2,460 | 3,053 | 3,697 | 4,022 | 4,259 | 4,744 | 4,937 | 4,033 | 2,795 |
| 2011 | 1,418 | 765 | 1,343 | 1,980 | 2,306 | 3,151 | 3,573 | 4,471 | 5,064 | 4,812 | 3,405 | 2,119 |
| 2012 | 2,085 | 1,411 | 1,529 | 2,041 | 2,554 | 3,144 | 3,637 | 4,908 | 5,007 | 4,851 | 3,477 | 2,248 |
| 2013 | 1,633 | 1,322 | 1,788 | 1,969 | 2,769 | 3,501 | 4,225 | 4,714 | 5,016 | 4,801 | 3,215 | 1,886 |
| 2014 | 1,042 | 1,005 | 1,137 | 2,098 | 2,640 | 3,356 | 4,277 | 4,453 | 4,701 | 4,850 | 3,770 | 2,325 |
| 2015 | 1,606 | 1,184 | 1,296 | 1,553 | 2,266 | 3,082 | 3,437 | 3,820 | 4,676 | 4,420 | 3,555 | 2,740 |
| 2016 | 1,734 | 1,115 | 1,445 | 2,014 | 2,244 | 3,089 | 3,886 | 4,576 | 4,932 | 4,690 | 3,520 | 2,306 |
| 2017 | 1,332 | 1,057 | 1,364 | 1,578 | 1,975 | 2,412 | 2,887 | 3,181 | 3,155 | 3,295 | 2,314 | 1,390 |
| 2018 | 1,142 | 974 | 1,186 | 1,464 | 1,905 | 2,445 | 2,851 | 3,493 | 3,752 | 4,012 | 2,949 | 1,658 |
| 2019 | 1,271 | 1,113 | 1,385 | 1,468 | 1,674 | 1,786 | 2,202 | 2,608 | 3,055 | 3,404 | 2,630 | 1,992 |
| 2020 | 1,592 | 1,194 | 1,295 | 1,783 | 1,891 | 2,050 | 2,295 | 2,725 | 2,920 | 2,826 | 2,557 | 1,686 |
| 2021 | 1,694 | 1,387 | 1,428 | 1,448 | 1,616 | 1,620 | 1,905 | 1,790 | 2,122 | 2,763 | 2,332 | 1,513 |
| 2022 | 1,627 | 1,716 | 1,562 | 1,646 | 1,624 | 1,826 | 2,083 | 2,489 | 2,909 | 2,990 | 2,760 | 2,033 |
| 2023 | 1,573 | 1,544 | 1,592 | 1,655 | 1,741 | 2,038 | 2,194 | 2,723 | 2,992 | 2,795 | 2,285 | 1,832 |
| 2024 | 1,472 | 1,248 | 1,222 | 1,477 | ||||||||
| - = No Data Reported; -- = Not Applicable; NA = Not Available; W = Withheld to avoid disclosure of individual company data. |
| Release Date: 6/28/2024 |
| Next Release Date: 7/31/2024 |