|
Download Data (XLS File) |
|
||||||||
|
||||||||
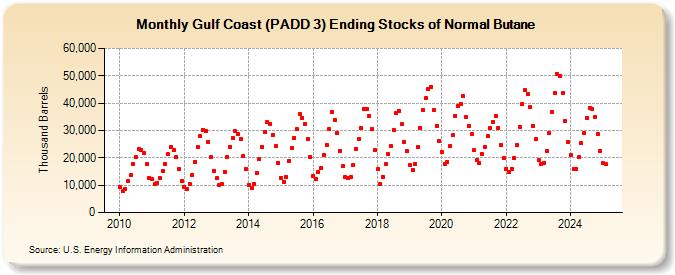
| Gulf Coast (PADD 3) Ending Stocks of Normal Butane (Thousand Barrels) | ||||||||
| Year | Jan | Feb | Mar | Apr | May | Jun | Jul | Aug | Sep | Oct | Nov | Dec |
|---|---|---|---|---|---|---|---|---|---|---|---|---|
| 2010 | 9,412 | 7,771 | 8,748 | 11,402 | 13,597 | 17,737 | 20,302 | 23,206 | 22,953 | 21,839 | 17,637 | 12,704 |
| 2011 | 12,212 | 10,317 | 10,980 | 12,511 | 15,279 | 17,786 | 21,320 | 23,958 | 22,737 | 20,379 | 15,856 | 11,460 |
| 2012 | 9,215 | 8,649 | 10,460 | 13,549 | 18,604 | 23,873 | 28,025 | 30,344 | 29,986 | 25,890 | 20,128 | 15,352 |
| 2013 | 12,492 | 10,191 | 10,390 | 14,832 | 20,250 | 24,082 | 27,412 | 29,669 | 28,563 | 26,792 | 20,590 | 15,957 |
| 2014 | 10,236 | 9,017 | 10,524 | 14,377 | 19,461 | 23,976 | 29,597 | 33,144 | 32,521 | 28,239 | 24,177 | 18,221 |
| 2015 | 12,764 | 11,194 | 13,132 | 18,936 | 23,654 | 27,355 | 30,531 | 36,005 | 34,652 | 32,500 | 27,019 | 20,336 |
| 2016 | 13,463 | 12,205 | 14,792 | 16,335 | 21,214 | 24,830 | 30,536 | 36,929 | 33,923 | 28,979 | 22,659 | 16,864 |
| 2017 | 12,987 | 12,660 | 12,846 | 17,239 | 23,253 | 27,012 | 30,775 | 37,854 | 37,702 | 35,411 | 30,548 | 22,726 |
| 2018 | 15,739 | 10,423 | 13,109 | 17,570 | 21,232 | 24,274 | 30,189 | 36,213 | 37,248 | 32,252 | 25,762 | 22,421 |
| 2019 | 17,351 | 15,702 | 17,870 | 23,902 | 30,920 | 37,473 | 41,819 | 45,171 | 45,980 | 37,504 | 31,645 | 26,154 |
| 2020 | 22,038 | 17,909 | 18,590 | 24,328 | 28,216 | 35,425 | 38,804 | 39,832 | 42,550 | 34,753 | 31,730 | 28,678 |
| 2021 | 22,760 | 19,092 | 17,942 | 21,538 | 24,106 | 27,799 | 30,926 | 32,917 | 35,196 | 30,911 | 24,656 | 19,928 |
| 2022 | 16,067 | 14,741 | 16,058 | 19,996 | 24,541 | 31,396 | 39,577 | 44,725 | 43,212 | 38,532 | 31,704 | 26,706 |
| 2023 | 19,010 | 17,604 | 18,247 | 22,504 | 28,975 | 36,670 | 43,768 | 50,477 | 50,091 | 43,750 | 33,291 | 25,665 |
| 2024 | 21,094 | |||||||||||
| - = No Data Reported; -- = Not Applicable; NA = Not Available; W = Withheld to avoid disclosure of individual company data. |
| Release Date: 3/29/2024 |
| Next Release Date: 4/30/2024 |