|
Download Data (XLS File) |
|
||||||||
|
||||||||
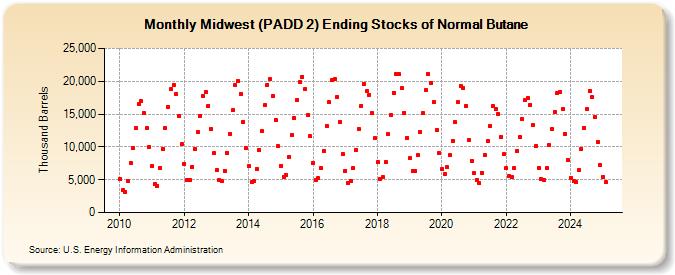
| Midwest (PADD 2) Ending Stocks of Normal Butane (Thousand Barrels) | ||||||||
| Year | Jan | Feb | Mar | Apr | May | Jun | Jul | Aug | Sep | Oct | Nov | Dec |
|---|---|---|---|---|---|---|---|---|---|---|---|---|
| 2010 | 5,127 | 3,382 | 3,161 | 4,804 | 7,588 | 9,778 | 12,838 | 16,456 | 16,954 | 15,145 | 12,888 | 10,005 |
| 2011 | 7,032 | 4,279 | 4,101 | 6,800 | 9,650 | 12,869 | 16,127 | 18,746 | 19,455 | 18,083 | 14,692 | 10,385 |
| 2012 | 7,408 | 4,931 | 4,969 | 6,967 | 9,672 | 12,220 | 14,760 | 17,782 | 18,348 | 16,302 | 12,737 | 9,043 |
| 2013 | 6,478 | 4,975 | 4,732 | 6,393 | 9,079 | 12,025 | 15,575 | 19,383 | 20,024 | 18,119 | 13,842 | 9,787 |
| 2014 | 7,068 | 4,648 | 4,861 | 6,702 | 9,489 | 12,418 | 16,347 | 19,478 | 20,264 | 17,755 | 14,118 | 10,061 |
| 2015 | 7,135 | 5,464 | 5,751 | 8,479 | 11,793 | 14,365 | 17,065 | 19,838 | 20,657 | 18,766 | 14,839 | 11,595 |
| 2016 | 7,543 | 4,970 | 5,216 | 6,744 | 9,449 | 13,188 | 16,789 | 20,141 | 20,324 | 17,650 | 13,760 | 8,885 |
| 2017 | 6,390 | 4,543 | 4,818 | 6,753 | 9,518 | 12,750 | 16,255 | 19,610 | 18,461 | 17,915 | 15,127 | 11,313 |
| 2018 | 7,698 | 5,109 | 5,397 | 7,735 | 11,911 | 14,882 | 18,249 | 21,129 | 21,026 | 18,991 | 15,214 | 11,392 |
| 2019 | 8,235 | 6,382 | 6,399 | 8,745 | 12,338 | 15,149 | 18,653 | 21,115 | 19,787 | 16,823 | 12,570 | 9,143 |
| 2020 | 6,594 | 5,831 | 6,878 | 8,746 | 10,944 | 13,758 | 16,781 | 19,346 | 18,956 | 16,289 | 11,069 | 7,916 |
| 2021 | 5,978 | 4,976 | 4,477 | 6,070 | 8,773 | 10,880 | 13,216 | 16,197 | 15,715 | 15,039 | 11,522 | 8,853 |
| 2022 | 6,716 | 5,532 | 5,402 | 6,771 | 9,400 | 11,464 | 14,240 | 17,129 | 17,433 | 16,400 | 13,280 | 10,101 |
| 2023 | 6,836 | 5,065 | 4,979 | 6,716 | 10,205 | 12,319 | 15,042 | 17,837 | 18,068 | 15,654 | 11,979 | 7,942 |
| 2024 | 5,337 | 4,734 | 4,644 | 6,417 | ||||||||
| - = No Data Reported; -- = Not Applicable; NA = Not Available; W = Withheld to avoid disclosure of individual company data. |
| Release Date: 6/28/2024 |
| Next Release Date: 7/31/2024 |