|
Download Data (XLS File) |
|
||||||||
|
||||||||
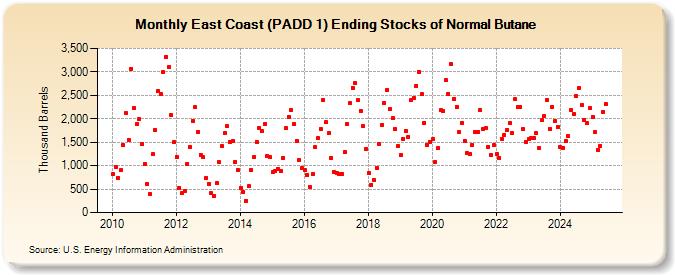
| East Coast (PADD 1) Ending Stocks of Normal Butane (Thousand Barrels) | ||||||||
| Year | Jan | Feb | Mar | Apr | May | Jun | Jul | Aug | Sep | Oct | Nov | Dec |
|---|---|---|---|---|---|---|---|---|---|---|---|---|
| 2010 | 813 | 972 | 746 | 903 | 1,432 | 2,120 | 1,552 | 3,069 | 2,226 | 1,879 | 1,993 | 1,459 |
| 2011 | 1,041 | 608 | 396 | 1,239 | 1,758 | 2,581 | 2,535 | 2,990 | 3,327 | 3,113 | 2,079 | 1,494 |
| 2012 | 1,190 | 526 | 413 | 458 | 1,044 | 1,400 | 1,962 | 2,245 | 1,724 | 1,233 | 1,177 | 737 |
| 2013 | 616 | 409 | 358 | 622 | 1,072 | 1,418 | 1,689 | 1,840 | 1,500 | 1,516 | 1,081 | 902 |
| 2014 | 532 | 438 | 257 | 560 | 914 | 1,184 | 1,513 | 1,807 | 1,730 | 1,884 | 1,211 | 1,176 |
| 2015 | 857 | 888 | 939 | 893 | 1,165 | 1,798 | 2,033 | 2,178 | 1,887 | 1,525 | 1,116 | 944 |
| 2016 | 914 | 807 | 545 | 827 | 1,389 | 1,579 | 1,791 | 2,407 | 1,924 | 1,687 | 1,163 | 872 |
| 2017 | 838 | 818 | 825 | 1,286 | 1,885 | 2,327 | 2,663 | 2,771 | 2,391 | 2,173 | 1,840 | 1,356 |
| 2018 | 840 | 595 | 699 | 960 | 1,452 | 1,867 | 2,332 | 2,621 | 2,209 | 2,019 | 1,782 | 1,420 |
| 2019 | 1,218 | 1,573 | 1,736 | 1,616 | 2,407 | 2,439 | 2,705 | 3,003 | 2,520 | 1,917 | 1,451 | 1,500 |
| 2020 | 1,561 | 1,075 | 1,367 | 2,181 | 2,160 | 2,818 | 2,535 | 3,158 | 2,427 | 2,252 | 1,711 | 1,912 |
| 2021 | 1,533 | 1,266 | 1,256 | 1,443 | 1,708 | 1,727 | 2,176 | 1,772 | 1,800 | 1,403 | 1,227 | 1,443 |
| 2022 | 1,244 | 1,166 | 1,574 | 1,654 | 1,768 | 1,910 | 1,696 | 2,415 | 2,240 | 2,246 | 1,774 | 1,514 |
| 2023 | 1,570 | 1,583 | 1,538 | 1,691 | 1,368 | 1,973 | 1,905 | 2,394 | 1,777 | 2,240 | 1,954 | 1,782 |
| 2024 | 1,370 | |||||||||||
| - = No Data Reported; -- = Not Applicable; NA = Not Available; W = Withheld to avoid disclosure of individual company data. |
| Release Date: 3/29/2024 |
| Next Release Date: 4/30/2024 |