|
Download Data (XLS File) |
|
||||||||
|
||||||||
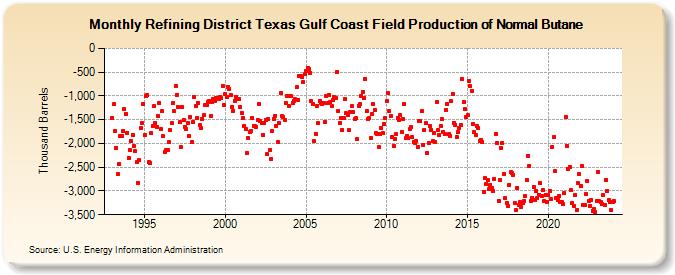
| Refining District Texas Gulf Coast Field Production of Normal Butane (Thousand Barrels) | ||||||||
| Year | Jan | Feb | Mar | Apr | May | Jun | Jul | Aug | Sep | Oct | Nov | Dec |
|---|---|---|---|---|---|---|---|---|---|---|---|---|
| 1993 | -1,462 | -1,176 | -1,737 | -2,093 | -2,647 | -2,427 | -1,840 | -1,853 | -1,738 | -1,280 | -1,371 | -1,775 |
| 1994 | -2,311 | -2,137 | -1,947 | -1,820 | -2,049 | -2,166 | -2,394 | -2,825 | -2,356 | -1,683 | -1,566 | -1,178 |
| 1995 | -1,833 | -994 | -985 | -2,397 | -2,417 | -1,785 | -1,635 | -1,213 | -1,566 | -1,650 | -1,415 | -1,147 |
| 1996 | -1,698 | -1,318 | -1,850 | -2,181 | -2,129 | -2,132 | -1,974 | -1,713 | -1,576 | -1,152 | -1,327 | -796 |
| 1997 | -975 | -1,225 | -1,557 | -2,078 | -1,232 | -1,516 | -1,645 | -1,694 | -1,560 | -1,839 | -1,445 | -1,972 |
| 1998 | -1,545 | -1,020 | -1,206 | -1,459 | -1,152 | -1,614 | -1,685 | -1,478 | -1,412 | -1,187 | -1,185 | -1,137 |
| 1999 | -1,109 | -1,423 | -1,120 | -1,071 | -1,114 | -1,034 | -1,041 | -1,055 | -1,029 | -1,044 | -788 | -1,195 |
| 2000 | -962 | -1,016 | -804 | -853 | -981 | -1,228 | -1,308 | -1,097 | -1,014 | -1,067 | -1,069 | -1,227 |
| 2001 | -1,356 | -1,471 | -1,632 | -1,701 | -2,200 | -1,878 | -1,756 | -1,730 | -1,459 | -1,637 | -1,640 | -1,654 |
| 2002 | -1,498 | -1,165 | -1,534 | -1,580 | -1,822 | -1,577 | -1,498 | -2,231 | -1,488 | -2,143 | -2,321 | -1,743 |
| 2003 | -1,488 | -1,415 | -1,625 | -1,980 | -1,576 | -933 | -1,423 | -1,450 | -1,509 | -1,151 | -1,006 | -1,213 |
| 2004 | -997 | -1,008 | -1,149 | -1,102 | -1,074 | -821 | -1,085 | -574 | -587 | -593 | -711 | -543 |
| 2005 | -472 | -414 | -430 | -510 | -1,113 | -1,172 | -1,947 | -1,791 | -1,204 | -1,573 | -1,097 | -1,156 |
| 2006 | -1,160 | -1,148 | -1,545 | -994 | -1,154 | -991 | -1,136 | -1,217 | -1,087 | -1,022 | -1,036 | -498 |
| 2007 | -1,311 | -1,566 | -1,463 | -1,716 | -1,465 | -1,074 | -1,368 | -1,401 | -1,727 | -1,336 | -1,210 | -1,339 |
| 2008 | -1,492 | -1,475 | -1,913 | -1,203 | -1,179 | -994 | -910 | -1,043 | -646 | -1,328 | -1,476 | -1,470 |
| 2009 | -1,887 | -1,371 | -1,171 | -1,301 | -1,786 | -1,800 | -2,069 | -1,800 | -1,674 | -1,790 | -1,595 | -1,462 |
| 2010 | -1,115 | -947 | -1,325 | -1,421 | -1,859 | -2,054 | -1,909 | -1,800 | -1,468 | -1,505 | -1,405 | -1,759 |
| 2011 | -1,491 | -1,172 | -1,895 | -1,840 | -1,896 | -1,697 | -1,651 | -1,870 | -1,978 | -1,991 | -1,942 | -2,065 |
| 2012 | -1,537 | -1,530 | -1,328 | -2,026 | -1,713 | -1,566 | -2,193 | -1,989 | -1,627 | -1,707 | -1,955 | -1,790 |
| 2013 | -1,965 | -1,137 | -1,721 | -1,825 | -1,625 | -1,492 | -1,768 | -1,812 | -1,288 | -1,177 | -1,803 | -1,834 |
| 2014 | -1,116 | -955 | -1,562 | -1,606 | -1,866 | -1,769 | -1,671 | -1,607 | -652 | -1,121 | -1,284 | -1,449 |
| 2015 | -1,412 | -676 | -791 | -889 | -1,589 | -1,767 | -1,816 | -1,628 | -1,675 | -1,943 | -1,918 | -1,979 |
| 2016 | -3,013 | -2,733 | -2,851 | -2,768 | -2,956 | -2,869 | -2,932 | -2,999 | -2,742 | -1,791 | -1,988 | -3,207 |
| 2017 | -2,762 | -2,087 | -1,987 | -2,634 | -3,155 | -3,257 | -3,322 | -2,867 | -2,611 | -2,632 | -2,654 | -3,249 |
| 2018 | -3,409 | -2,934 | -3,294 | -3,225 | -3,338 | -3,255 | -3,208 | -3,105 | -2,777 | -2,260 | -2,470 | -3,207 |
| 2019 | -3,148 | -2,915 | -3,189 | -3,010 | -3,146 | -3,078 | -2,841 | -3,104 | -2,990 | -3,212 | -3,079 | -3,224 |
| 2020 | -3,095 | -3,003 | -3,178 | -2,067 | -1,867 | -2,589 | -3,139 | -3,183 | -3,101 | -3,235 | -3,234 | -3,279 |
| 2021 | -3,040 | -1,441 | -2,044 | -2,534 | -2,495 | -2,982 | -3,263 | -3,309 | -3,090 | -3,403 | -2,840 | -2,652 |
| 2022 | -2,899 | -2,473 | -3,288 | -3,291 | -3,060 | -2,787 | -3,209 | -3,310 | -3,182 | -3,413 | -3,389 | -3,439 |
| 2023 | -3,216 | -2,593 | -3,219 | -3,228 | -3,279 | -3,095 | -3,288 | -2,768 | -2,997 | -3,182 | -3,238 | -3,409 |
| 2024 | -3,239 | |||||||||||
| - = No Data Reported; -- = Not Applicable; NA = Not Available; W = Withheld to avoid disclosure of individual company data. |
| Release Date: 3/29/2024 |
| Next Release Date: 4/30/2024 |