|
Download Data (XLS File) |
|
||||||||
|
||||||||
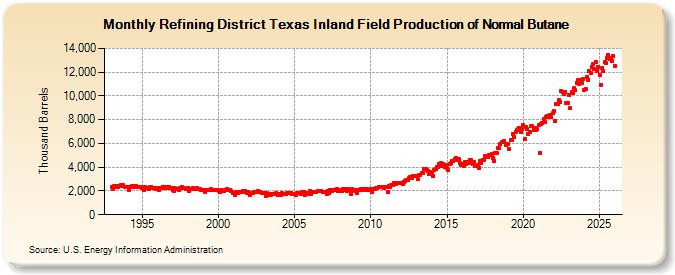
| Refining District Texas Inland Field Production of Normal Butane (Thousand Barrels) | ||||||||
| Year | Jan | Feb | Mar | Apr | May | Jun | Jul | Aug | Sep | Oct | Nov | Dec |
|---|---|---|---|---|---|---|---|---|---|---|---|---|
| 1993 | 2,334 | 2,156 | 2,436 | 2,367 | 2,441 | 2,342 | 2,457 | 2,470 | 2,415 | 2,479 | 2,341 | 2,297 |
| 1994 | 2,293 | 2,085 | 2,352 | 2,293 | 2,378 | 2,320 | 2,455 | 2,445 | 2,345 | 2,358 | 2,295 | 2,304 |
| 1995 | 2,254 | 2,072 | 2,296 | 2,247 | 2,273 | 2,163 | 2,329 | 2,342 | 2,262 | 2,288 | 2,244 | 2,184 |
| 1996 | 2,207 | 2,049 | 2,263 | 2,213 | 2,317 | 2,216 | 2,354 | 2,371 | 2,240 | 2,291 | 2,227 | 2,214 |
| 1997 | 2,122 | 2,006 | 2,227 | 2,175 | 2,193 | 2,122 | 2,245 | 2,310 | 2,211 | 2,251 | 2,192 | 2,205 |
| 1998 | 2,263 | 2,030 | 2,198 | 2,182 | 2,248 | 2,174 | 2,188 | 2,228 | 2,166 | 2,179 | 2,115 | 2,055 |
| 1999 | 2,054 | 1,883 | 2,103 | 2,042 | 2,052 | 2,073 | 2,123 | 2,059 | 2,058 | 2,119 | 2,057 | 2,062 |
| 2000 | 2,031 | 1,936 | 2,043 | 2,033 | 2,022 | 2,041 | 2,114 | 2,192 | 2,095 | 2,121 | 2,037 | 1,834 |
| 2001 | 1,814 | 1,662 | 1,879 | 1,787 | 1,939 | 1,876 | 1,942 | 1,985 | 1,910 | 1,978 | 1,852 | 1,902 |
| 2002 | 1,801 | 1,671 | 1,857 | 1,821 | 1,896 | 1,870 | 1,929 | 1,961 | 1,902 | 1,920 | 1,857 | 1,857 |
| 2003 | 1,803 | 1,601 | 1,789 | 1,694 | 1,736 | 1,666 | 1,711 | 1,753 | 1,716 | 1,797 | 1,747 | 1,687 |
| 2004 | 1,782 | 1,643 | 1,807 | 1,744 | 1,764 | 1,734 | 1,830 | 1,837 | 1,802 | 1,850 | 1,725 | 1,746 |
| 2005 | 1,766 | 1,658 | 1,854 | 1,833 | 1,816 | 1,750 | 1,888 | 1,872 | 1,671 | 1,858 | 1,798 | 1,765 |
| 2006 | 1,991 | 1,738 | 1,947 | 1,894 | 1,948 | 1,919 | 1,971 | 1,971 | 1,973 | 2,036 | 1,932 | 1,945 |
| 2007 | 1,872 | 1,744 | 1,997 | 1,869 | 2,079 | 1,974 | 2,076 | 2,067 | 2,079 | 2,137 | 2,031 | 2,055 |
| 2008 | 2,009 | 1,972 | 2,158 | 2,071 | 2,140 | 2,021 | 2,131 | 2,118 | 1,732 | 2,142 | 2,012 | 2,084 |
| 2009 | 2,073 | 1,848 | 2,098 | 2,068 | 2,191 | 2,102 | 2,135 | 2,190 | 2,095 | 2,133 | 2,053 | 2,085 |
| 2010 | 2,169 | 1,946 | 2,206 | 2,154 | 2,247 | 2,230 | 2,332 | 2,342 | 2,307 | 2,356 | 2,251 | 2,354 |
| 2011 | 2,327 | 1,903 | 2,452 | 2,326 | 2,511 | 2,462 | 2,646 | 2,645 | 2,561 | 2,710 | 2,655 | 2,641 |
| 2012 | 2,711 | 2,582 | 2,764 | 2,841 | 2,927 | 2,907 | 3,101 | 3,180 | 3,127 | 3,290 | 3,240 | 3,242 |
| 2013 | 3,227 | 2,965 | 3,367 | 3,380 | 3,484 | 3,494 | 3,877 | 3,882 | 3,758 | 3,700 | 3,465 | 3,556 |
| 2014 | 3,601 | 3,268 | 3,778 | 3,865 | 3,987 | 3,984 | 4,297 | 4,336 | 4,107 | 4,230 | 3,978 | 4,189 |
| 2015 | 3,920 | 3,727 | 4,265 | 4,354 | 4,539 | 4,548 | 4,713 | 4,755 | 4,604 | 4,649 | 4,363 | 4,219 |
| 2016 | 4,235 | 4,111 | 4,449 | 4,262 | 4,477 | 4,375 | 4,573 | 4,580 | 4,302 | 4,437 | 4,114 | 4,059 |
| 2017 | 4,165 | 3,974 | 4,525 | 4,379 | 4,640 | 4,570 | 4,905 | 4,839 | 4,866 | 5,064 | 5,049 | 5,091 |
| 2018 | 4,761 | 4,550 | 5,215 | 5,211 | 5,639 | 5,577 | 5,951 | 6,111 | 6,079 | 6,188 | 5,877 | 5,972 |
| 2019 | 5,967 | 5,561 | 6,251 | 6,319 | 6,799 | 6,559 | 6,952 | 7,143 | 7,185 | 7,262 | 6,944 | 7,234 |
| 2020 | 7,523 | 6,356 | 7,360 | 7,192 | 6,781 | 6,947 | 7,442 | 7,470 | 7,141 | 7,314 | 7,099 | 7,191 |
| 2021 | 7,568 | 5,233 | 7,606 | 7,719 | 8,051 | 7,774 | 8,227 | 8,295 | 8,185 | 8,431 | 8,203 | 8,525 |
| 2022 | 8,718 | 7,875 | 9,307 | 9,360 | 9,621 | 9,448 | 10,440 | 10,294 | 10,129 | 10,343 | 9,369 | 9,389 |
| 2023 | 8,795 | 7,788 | 9,294 | 9,712 | 10,293 | 10,156 | 10,875 | 11,028 | 11,114 | 11,231 | 10,918 | 11,022 |
| 2024 | 10,523 | |||||||||||
| - = No Data Reported; -- = Not Applicable; NA = Not Available; W = Withheld to avoid disclosure of individual company data. |
| Release Date: 3/29/2024 |
| Next Release Date: 4/30/2024 |