|
Download Data (XLS File) |
|
||||||||
|
||||||||
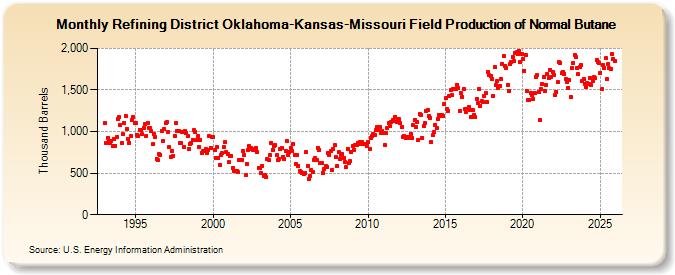
| Refining District Oklahoma-Kansas-Missouri Field Production of Normal Butane (Thousand Barrels) | ||||||||
| Year | Jan | Feb | Mar | Apr | May | Jun | Jul | Aug | Sep | Oct | Nov | Dec |
|---|---|---|---|---|---|---|---|---|---|---|---|---|
| 1993 | 1,103 | 863 | 927 | 887 | 858 | 887 | 825 | 911 | 830 | 934 | 1,151 | 1,172 |
| 1994 | 1,077 | 861 | 966 | 1,102 | 1,184 | 1,036 | 905 | 866 | 946 | 1,138 | 1,178 | 1,098 |
| 1995 | 1,098 | 962 | 949 | 1,024 | 1,020 | 967 | 1,046 | 1,090 | 950 | 1,108 | 1,046 | 1,041 |
| 1996 | 1,006 | 845 | 970 | 932 | 671 | 652 | 725 | 722 | 1,004 | 889 | 1,031 | 1,106 |
| 1997 | 1,112 | 1,000 | 819 | 700 | 766 | 712 | 948 | 1,100 | 1,011 | 1,004 | 864 | 862 |
| 1998 | 990 | 816 | 1,002 | 985 | 947 | 795 | 855 | 865 | 897 | 1,015 | 999 | 897 |
| 1999 | 945 | 820 | 901 | 746 | 769 | 768 | 787 | 747 | 781 | 944 | 806 | 933 |
| 2000 | 936 | 776 | 686 | 819 | 680 | 602 | 723 | 739 | 817 | 872 | 753 | 729 |
| 2001 | 630 | 709 | 712 | 562 | 529 | 529 | 528 | 512 | 662 | 663 | 659 | 769 |
| 2002 | 717 | 472 | 604 | 778 | 824 | 802 | 787 | 775 | 779 | 808 | 754 | 565 |
| 2003 | 559 | 496 | 591 | 471 | 473 | 448 | 667 | 656 | 719 | 860 | 784 | 825 |
| 2004 | 835 | 714 | 654 | 668 | 790 | 806 | 694 | 665 | 767 | 883 | 723 | 750 |
| 2005 | 806 | 769 | 850 | 722 | 609 | 713 | 590 | 524 | 516 | 506 | 489 | 503 |
| 2006 | 752 | 590 | 431 | 465 | 536 | 509 | 661 | 683 | 660 | 806 | 782 | 622 |
| 2007 | 616 | 499 | 553 | 585 | 577 | 741 | 722 | 767 | 542 | 795 | 838 | 689 |
| 2008 | 581 | 749 | 667 | 717 | 733 | 685 | 631 | 569 | 794 | 620 | 642 | 751 |
| 2009 | 826 | 782 | 842 | 838 | 864 | 847 | 880 | 878 | 855 | 848 | 845 | 823 |
| 2010 | 876 | 794 | 926 | 942 | 976 | 959 | 1,014 | 1,055 | 1,020 | 1,053 | 980 | 1,007 |
| 2011 | 979 | 837 | 984 | 1,040 | 1,098 | 1,063 | 1,117 | 1,139 | 1,128 | 1,178 | 1,116 | 1,149 |
| 2012 | 1,146 | 1,098 | 1,055 | 935 | 944 | 919 | 936 | 927 | 934 | 974 | 921 | 1,075 |
| 2013 | 1,144 | 1,056 | 1,112 | 899 | 1,206 | 1,199 | 928 | 1,061 | 1,105 | 1,248 | 1,254 | 1,186 |
| 2014 | 1,168 | 873 | 955 | 1,000 | 1,082 | 1,038 | 1,151 | 1,201 | 1,184 | 1,204 | 1,188 | 1,334 |
| 2015 | 1,400 | 1,271 | 1,253 | 1,425 | 1,497 | 1,437 | 1,515 | 1,511 | 1,508 | 1,563 | 1,527 | 1,249 |
| 2016 | 1,464 | 1,417 | 1,512 | 1,268 | 1,233 | 1,268 | 1,301 | 1,261 | 1,171 | 1,261 | 1,205 | 1,170 |
| 2017 | 1,390 | 1,343 | 1,516 | 1,311 | 1,363 | 1,360 | 1,423 | 1,464 | 1,355 | 1,714 | 1,677 | 1,671 |
| 2018 | 1,636 | 1,432 | 1,773 | 1,559 | 1,602 | 1,522 | 1,552 | 1,635 | 1,814 | 1,909 | 1,793 | 1,768 |
| 2019 | 1,565 | 1,485 | 1,812 | 1,836 | 1,893 | 1,848 | 1,947 | 1,953 | 1,927 | 1,972 | 1,837 | 1,937 |
| 2020 | 1,870 | 1,733 | 1,922 | 1,488 | 1,378 | 1,380 | 1,464 | 1,444 | 1,390 | 1,461 | 1,660 | 1,677 |
| 2021 | 1,476 | 1,141 | 1,507 | 1,571 | 1,660 | 1,489 | 1,562 | 1,690 | 1,641 | 1,745 | 1,659 | 1,717 |
| 2022 | 1,677 | 1,438 | 1,481 | 1,590 | 1,837 | 1,828 | 1,703 | 1,722 | 1,696 | 1,631 | 1,593 | 1,528 |
| 2023 | 1,481 | 1,303 | 1,630 | 1,740 | 1,921 | 1,890 | 1,757 | 1,693 | 1,782 | 1,805 | 1,609 | 1,628 |
| 2024 | 1,564 | |||||||||||
| - = No Data Reported; -- = Not Applicable; NA = Not Available; W = Withheld to avoid disclosure of individual company data. |
| Release Date: 3/29/2024 |
| Next Release Date: 4/30/2024 |