|
Download Data (XLS File) |
|
||||||||
|
||||||||
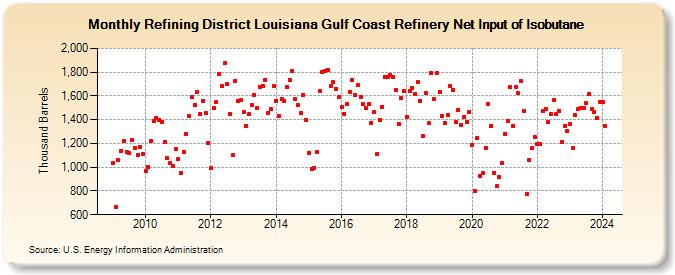
| Refining District Louisiana Gulf Coast Refinery Net Input of Isobutane (Thousand Barrels) | ||||||||
| Year | Jan | Feb | Mar | Apr | May | Jun | Jul | Aug | Sep | Oct | Nov | Dec |
|---|---|---|---|---|---|---|---|---|---|---|---|---|
| 2009 | 1,035 | 662 | 1,057 | 1,137 | 1,219 | 1,131 | 1,117 | 1,233 | 1,158 | 1,105 | 1,173 | 1,112 |
| 2010 | 968 | 1,002 | 1,221 | 1,391 | 1,411 | 1,399 | 1,383 | 1,211 | 1,079 | 1,032 | 1,007 | 1,155 |
| 2011 | 1,065 | 951 | 1,126 | 1,280 | 1,433 | 1,595 | 1,523 | 1,636 | 1,446 | 1,561 | 1,455 | 1,201 |
| 2012 | 990 | 1,502 | 1,552 | 1,784 | 1,686 | 1,873 | 1,700 | 1,451 | 1,099 | 1,729 | 1,555 | 1,569 |
| 2013 | 1,464 | 1,349 | 1,445 | 1,521 | 1,606 | 1,500 | 1,679 | 1,687 | 1,737 | 1,460 | 1,488 | 1,686 |
| 2014 | 1,560 | 1,434 | 1,571 | 1,561 | 1,675 | 1,733 | 1,810 | 1,576 | 1,527 | 1,455 | 1,610 | 1,400 |
| 2015 | 1,123 | 987 | 995 | 1,131 | 1,644 | 1,801 | 1,809 | 1,822 | 1,684 | 1,713 | 1,662 | 1,592 |
| 2016 | 1,504 | 1,451 | 1,531 | 1,637 | 1,736 | 1,604 | 1,689 | 1,587 | 1,528 | 1,495 | 1,528 | 1,371 |
| 2017 | 1,468 | 1,111 | 1,400 | 1,508 | 1,763 | 1,756 | 1,775 | 1,759 | 1,647 | 1,361 | 1,579 | 1,638 |
| 2018 | 1,419 | 1,644 | 1,668 | 1,619 | 1,715 | 1,560 | 1,264 | 1,626 | 1,368 | 1,792 | 1,571 | 1,791 |
| 2019 | 1,637 | 1,432 | 1,374 | 1,443 | 1,680 | 1,650 | 1,384 | 1,484 | 1,351 | 1,426 | 1,382 | 1,467 |
| 2020 | 1,189 | 801 | 1,245 | 927 | 947 | 1,160 | 1,533 | 1,350 | 955 | 839 | 920 | 1,036 |
| 2021 | 1,279 | 1,393 | 1,676 | 1,345 | 1,678 | 1,622 | 1,727 | 1,477 | 771 | 1,064 | 1,158 | 1,255 |
| 2022 | 1,198 | 1,193 | 1,472 | 1,491 | 1,382 | 1,445 | 1,562 | 1,451 | 1,470 | 1,212 | 1,347 | 1,307 |
| 2023 | 1,360 | 1,159 | 1,439 | 1,487 | 1,498 | 1,499 | 1,539 | 1,620 | 1,494 | 1,465 | 1,410 | 1,550 |
| 2024 | 1,549 | |||||||||||
| - = No Data Reported; -- = Not Applicable; NA = Not Available; W = Withheld to avoid disclosure of individual company data. |
| Release Date: 3/29/2024 |
| Next Release Date: 4/30/2024 |
Referring Pages: