|
Download Data (XLS File) |
|
||||||||
|
||||||||
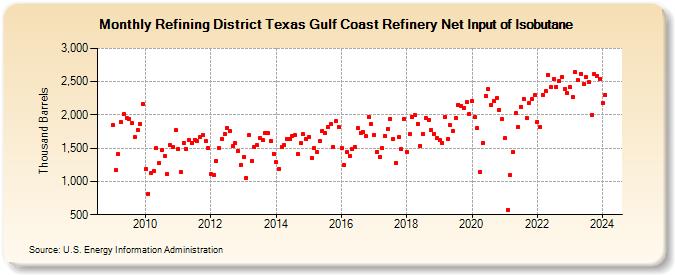
| Refining District Texas Gulf Coast Refinery Net Input of Isobutane (Thousand Barrels) | ||||||||
| Year | Jan | Feb | Mar | Apr | May | Jun | Jul | Aug | Sep | Oct | Nov | Dec |
|---|---|---|---|---|---|---|---|---|---|---|---|---|
| 2009 | 1,848 | 1,166 | 1,409 | 1,890 | 2,007 | 1,956 | 1,937 | 1,873 | 1,668 | 1,777 | 1,857 | 2,165 |
| 2010 | 1,186 | 817 | 1,127 | 1,158 | 1,501 | 1,273 | 1,468 | 1,385 | 1,115 | 1,542 | 1,521 | 1,771 |
| 2011 | 1,489 | 1,137 | 1,585 | 1,490 | 1,619 | 1,579 | 1,630 | 1,607 | 1,666 | 1,701 | 1,604 | 1,505 |
| 2012 | 1,111 | 1,096 | 1,308 | 1,498 | 1,645 | 1,711 | 1,808 | 1,757 | 1,526 | 1,573 | 1,455 | 1,253 |
| 2013 | 1,371 | 1,053 | 1,693 | 1,313 | 1,522 | 1,541 | 1,660 | 1,621 | 1,722 | 1,725 | 1,612 | 1,420 |
| 2014 | 1,287 | 1,194 | 1,515 | 1,545 | 1,642 | 1,641 | 1,677 | 1,694 | 1,420 | 1,572 | 1,708 | 1,636 |
| 2015 | 1,672 | 1,359 | 1,504 | 1,438 | 1,612 | 1,760 | 1,723 | 1,815 | 1,862 | 1,525 | 1,904 | 1,818 |
| 2016 | 1,504 | 1,254 | 1,441 | 1,388 | 1,490 | 1,515 | 1,802 | 1,735 | 1,742 | 1,678 | 1,968 | 1,861 |
| 2017 | 1,699 | 1,438 | 1,372 | 1,498 | 1,690 | 1,789 | 1,944 | 1,635 | 1,284 | 1,664 | 1,482 | 1,944 |
| 2018 | 1,445 | 1,706 | 1,975 | 1,994 | 1,868 | 1,531 | 1,719 | 1,960 | 1,924 | 1,771 | 1,718 | 1,648 |
| 2019 | 1,621 | 1,584 | 1,965 | 1,637 | 1,848 | 1,759 | 1,957 | 2,155 | 2,136 | 2,109 | 2,196 | 2,014 |
| 2020 | 2,212 | 1,970 | 1,803 | 1,149 | 1,579 | 2,287 | 2,384 | 2,155 | 2,202 | 2,253 | 2,074 | 1,934 |
| 2021 | 1,649 | 576 | 1,094 | 1,442 | 2,022 | 1,815 | 2,125 | 2,246 | 1,959 | 2,181 | 2,233 | 2,297 |
| 2022 | 1,901 | 1,821 | 2,300 | 2,357 | 2,604 | 2,415 | 2,537 | 2,425 | 2,513 | 2,570 | 2,392 | 2,328 |
| 2023 | 2,415 | 2,265 | 2,645 | 2,520 | 2,622 | 2,458 | 2,566 | 2,498 | 2,004 | 2,614 | 2,590 | 2,540 |
| 2024 | 2,177 | |||||||||||
| - = No Data Reported; -- = Not Applicable; NA = Not Available; W = Withheld to avoid disclosure of individual company data. |
| Release Date: 3/29/2024 |
| Next Release Date: 4/30/2024 |
Referring Pages: