|
Download Data (XLS File) |
|
||||||||
|
||||||||
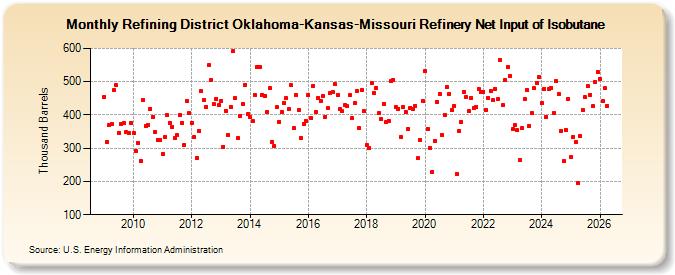
| Refining District Oklahoma-Kansas-Missouri Refinery Net Input of Isobutane (Thousand Barrels) | ||||||||
| Year | Jan | Feb | Mar | Apr | May | Jun | Jul | Aug | Sep | Oct | Nov | Dec |
|---|---|---|---|---|---|---|---|---|---|---|---|---|
| 2009 | 454 | 319 | 369 | 372 | 475 | 489 | 347 | 373 | 377 | 349 | 347 | 377 |
| 2010 | 346 | 292 | 317 | 262 | 446 | 367 | 371 | 419 | 394 | 350 | 324 | 325 |
| 2011 | 283 | 334 | 399 | 377 | 365 | 330 | 340 | 401 | 377 | 309 | 442 | 405 |
| 2012 | 377 | 334 | 270 | 353 | 471 | 444 | 425 | 550 | 506 | 433 | 449 | 429 |
| 2013 | 443 | 304 | 413 | 340 | 424 | 592 | 450 | 331 | 398 | 434 | 491 | 402 |
| 2014 | 395 | 382 | 461 | 545 | 544 | 461 | 457 | 409 | 480 | 319 | 307 | 423 |
| 2015 | 380 | 408 | 437 | 450 | 417 | 489 | 360 | 459 | 414 | 331 | 373 | 382 |
| 2016 | 460 | 392 | 488 | 409 | 452 | 442 | 457 | 395 | 420 | 466 | 469 | 492 |
| 2017 | 461 | 419 | 411 | 429 | 426 | 459 | 390 | 435 | 473 | 361 | 476 | 411 |
| 2018 | 310 | 301 | 497 | 466 | 482 | 405 | 387 | 433 | 378 | 383 | 503 | 505 |
| 2019 | 423 | 419 | 334 | 424 | 409 | 358 | 422 | 419 | 427 | 269 | 324 | 441 |
| 2020 | 532 | 359 | 300 | 229 | 323 | 440 | 464 | 340 | 401 | 484 | 464 | 414 |
| 2021 | 427 | 223 | 353 | 379 | 470 | 454 | 411 | 451 | 422 | 425 | 477 | 468 |
| 2022 | 469 | 415 | 451 | 472 | 444 | 478 | 447 | 565 | 429 | 504 | 545 | 517 |
| 2023 | 357 | 369 | 354 | 263 | 361 | 448 | 476 | 367 | 405 | 480 | 497 | 513 |
| 2024 | 435 | |||||||||||
| - = No Data Reported; -- = Not Applicable; NA = Not Available; W = Withheld to avoid disclosure of individual company data. |
| Release Date: 3/29/2024 |
| Next Release Date: 4/30/2024 |