|
Download Data (XLS File) |
|
||||||||
|
||||||||
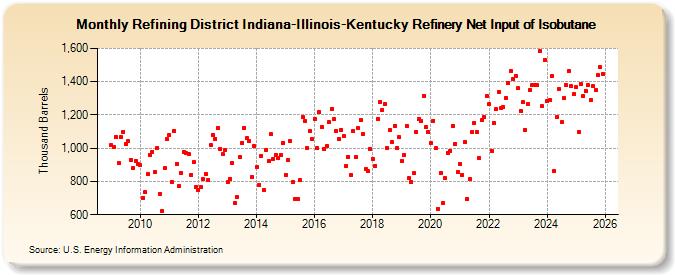
| Refining District Indiana-Illinois-Kentucky Refinery Net Input of Isobutane (Thousand Barrels) | ||||||||
| Year | Jan | Feb | Mar | Apr | May | Jun | Jul | Aug | Sep | Oct | Nov | Dec |
|---|---|---|---|---|---|---|---|---|---|---|---|---|
| 2009 | 1,017 | 1,006 | 1,069 | 911 | 1,069 | 1,099 | 1,024 | 1,041 | 929 | 879 | 922 | 907 |
| 2010 | 896 | 702 | 735 | 843 | 962 | 979 | 856 | 1,004 | 727 | 622 | 879 | 1,057 |
| 2011 | 1,077 | 797 | 1,105 | 907 | 770 | 852 | 980 | 971 | 965 | 841 | 914 | 767 |
| 2012 | 748 | 765 | 814 | 847 | 811 | 1,020 | 1,078 | 1,056 | 1,124 | 995 | 963 | 988 |
| 2013 | 795 | 817 | 910 | 671 | 706 | 946 | 1,031 | 1,124 | 1,059 | 1,044 | 827 | 1,012 |
| 2014 | 887 | 781 | 956 | 749 | 991 | 921 | 1,083 | 936 | 959 | 939 | 960 | 1,031 |
| 2015 | 841 | 927 | 1,041 | 796 | 692 | 696 | 807 | 1,186 | 1,164 | 1,002 | 1,103 | 1,056 |
| 2016 | 1,177 | 1,001 | 1,217 | 1,128 | 996 | 1,012 | 1,155 | 1,238 | 1,173 | 1,103 | 1,056 | 1,111 |
| 2017 | 1,073 | 893 | 949 | 841 | 1,102 | 944 | 1,120 | 1,172 | 1,083 | 875 | 862 | 998 |
| 2018 | 936 | 895 | 1,176 | 1,277 | 1,231 | 1,267 | 1,002 | 1,109 | 1,037 | 1,135 | 1,003 | 1,065 |
| 2019 | 923 | 959 | 1,135 | 818 | 796 | 849 | 1,100 | 1,178 | 1,163 | 1,316 | 1,127 | 1,098 |
| 2020 | 1,031 | 1,166 | 999 | 637 | 850 | 673 | 819 | 973 | 986 | 1,136 | 1,027 | 856 |
| 2021 | 904 | 838 | 1,038 | 695 | 813 | 1,095 | 1,153 | 1,098 | 940 | 1,168 | 1,188 | 1,313 |
| 2022 | 1,263 | 985 | 1,153 | 1,233 | 1,338 | 1,240 | 1,245 | 1,304 | 1,389 | 1,467 | 1,415 | 1,436 |
| 2023 | 1,359 | 1,224 | 1,275 | 1,112 | 1,267 | 1,352 | 1,379 | 1,382 | 1,378 | 1,585 | 1,251 | 1,532 |
| 2024 | 1,329 | |||||||||||
| - = No Data Reported; -- = Not Applicable; NA = Not Available; W = Withheld to avoid disclosure of individual company data. |
| Release Date: 3/29/2024 |
| Next Release Date: 4/30/2024 |