|
Download Data (XLS File) |
|
||||||||
|
||||||||
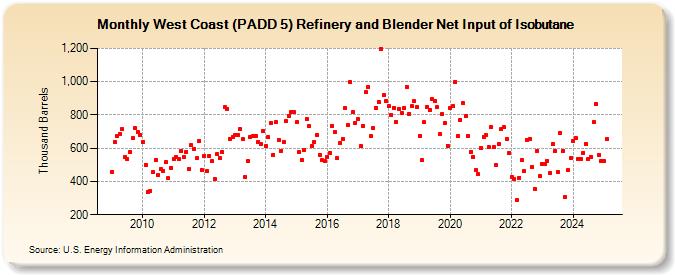
| West Coast (PADD 5) Refinery and Blender Net Input of Isobutane (Thousand Barrels) | ||||||||
| Year | Jan | Feb | Mar | Apr | May | Jun | Jul | Aug | Sep | Oct | Nov | Dec |
|---|---|---|---|---|---|---|---|---|---|---|---|---|
| 2009 | 458 | 638 | 675 | 686 | 715 | 547 | 534 | 578 | 659 | 722 | 695 | 680 |
| 2010 | 639 | 500 | 338 | 344 | 454 | 529 | 437 | 476 | 465 | 514 | 419 | 483 |
| 2011 | 535 | 549 | 535 | 585 | 548 | 579 | 477 | 619 | 597 | 539 | 645 | 471 |
| 2012 | 554 | 461 | 556 | 520 | 415 | 563 | 540 | 578 | 845 | 838 | 658 | 669 |
| 2013 | 679 | 682 | 714 | 655 | 427 | 521 | 669 | 674 | 674 | 638 | 625 | 704 |
| 2014 | 613 | 666 | 750 | 561 | 755 | 650 | 586 | 638 | 761 | 796 | 818 | 820 |
| 2015 | 755 | 575 | 528 | 591 | 774 | 732 | 615 | 637 | 682 | 561 | 528 | 523 |
| 2016 | 547 | 574 | 736 | 697 | 539 | 630 | 658 | 843 | 738 | 997 | 816 | 754 |
| 2017 | 776 | 613 | 734 | 936 | 967 | 671 | 720 | 844 | 880 | 1,199 | 918 | 884 |
| 2018 | 852 | 801 | 844 | 759 | 836 | 813 | 843 | 969 | 808 | 852 | 882 | 845 |
| 2019 | 676 | 527 | 755 | 848 | 831 | 894 | 883 | 845 | 683 | 805 | 752 | 616 |
| 2020 | 839 | 852 | 1,000 | 674 | 771 | 869 | 792 | 675 | 579 | 547 | 468 | 442 |
| 2021 | 602 | 669 | 678 | 606 | 725 | 607 | 496 | 628 | 714 | 725 | 658 | 574 |
| 2022 | 426 | 415 | 286 | 423 | 529 | 461 | 652 | 654 | 486 | 357 | 582 | 431 |
| 2023 | 507 | 505 | 522 | 450 | 625 | 585 | 457 | 694 | 585 | 306 | 466 | 539 |
| 2024 | 644 | |||||||||||
| - = No Data Reported; -- = Not Applicable; NA = Not Available; W = Withheld to avoid disclosure of individual company data. |
| Release Date: 3/29/2024 |
| Next Release Date: 4/30/2024 |