|
Download Data (XLS File) |
|
||||||||
|
||||||||
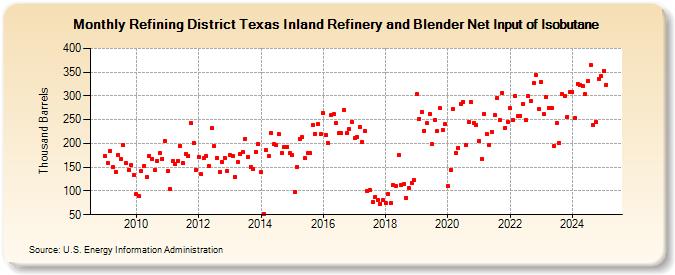
| Refining District Texas Inland Refinery and Blender Net Input of Isobutane (Thousand Barrels) | ||||||||
| Year | Jan | Feb | Mar | Apr | May | Jun | Jul | Aug | Sep | Oct | Nov | Dec |
|---|---|---|---|---|---|---|---|---|---|---|---|---|
| 2009 | 173 | 159 | 184 | 150 | 140 | 176 | 168 | 196 | 158 | 144 | 154 | 134 |
| 2010 | 93 | 89 | 141 | 153 | 129 | 174 | 168 | 144 | 164 | 179 | 168 | 206 |
| 2011 | 141 | 104 | 163 | 157 | 164 | 195 | 158 | 178 | 174 | 243 | 201 | 145 |
| 2012 | 172 | 135 | 169 | 174 | 153 | 232 | 194 | 170 | 140 | 161 | 170 | 143 |
| 2013 | 175 | 173 | 130 | 160 | 177 | 182 | 210 | 172 | 151 | 147 | 183 | 199 |
| 2014 | 139 | 52 | 186 | 173 | 222 | 198 | 197 | 219 | 180 | 192 | 192 | 179 |
| 2015 | 176 | 98 | 151 | 210 | 213 | 169 | 179 | 180 | 239 | 220 | 241 | 219 |
| 2016 | 263 | 218 | 200 | 259 | 261 | 242 | 221 | 221 | 271 | 221 | 230 | 246 |
| 2017 | 211 | 214 | 235 | 204 | 227 | 100 | 103 | 77 | 88 | 81 | 73 | 82 |
| 2018 | 74 | 94 | 75 | 112 | 111 | 175 | 113 | 114 | 86 | 106 | 117 | 123 |
| 2019 | 303 | 252 | 267 | 227 | 242 | 262 | 198 | 250 | 226 | 274 | 229 | 240 |
| 2020 | 110 | 145 | 272 | 180 | 191 | 282 | 288 | 197 | 245 | 287 | 244 | 238 |
| 2021 | 205 | 168 | 262 | 220 | 196 | 225 | 259 | 296 | 249 | 307 | 233 | 245 |
| 2022 | 274 | 249 | 299 | 258 | 258 | 284 | 250 | 299 | 290 | 327 | 344 | 272 |
| 2023 | 330 | 261 | 298 | 275 | 274 | 195 | 244 | 201 | 304 | 300 | 256 | 308 |
| 2024 | 309 | |||||||||||
| - = No Data Reported; -- = Not Applicable; NA = Not Available; W = Withheld to avoid disclosure of individual company data. |
| Release Date: 3/29/2024 |
| Next Release Date: 4/30/2024 |