|
Download Data (XLS File) |
|
||||||||
|
||||||||
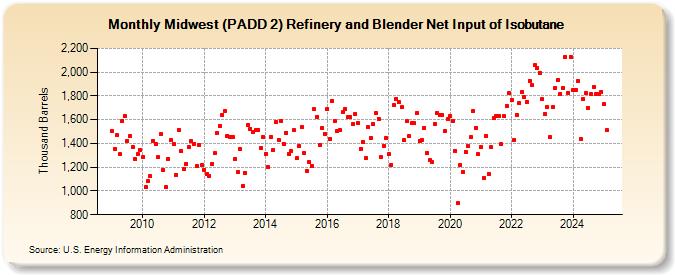
| Midwest (PADD 2) Refinery and Blender Net Input of Isobutane (Thousand Barrels) | ||||||||
| Year | Jan | Feb | Mar | Apr | May | Jun | Jul | Aug | Sep | Oct | Nov | Dec |
|---|---|---|---|---|---|---|---|---|---|---|---|---|
| 2009 | 1,502 | 1,357 | 1,468 | 1,308 | 1,587 | 1,630 | 1,424 | 1,463 | 1,370 | 1,266 | 1,307 | 1,345 |
| 2010 | 1,285 | 1,032 | 1,081 | 1,124 | 1,423 | 1,397 | 1,283 | 1,478 | 1,175 | 1,030 | 1,271 | 1,426 |
| 2011 | 1,394 | 1,137 | 1,515 | 1,337 | 1,184 | 1,229 | 1,370 | 1,418 | 1,395 | 1,213 | 1,389 | 1,215 |
| 2012 | 1,177 | 1,142 | 1,128 | 1,225 | 1,317 | 1,486 | 1,548 | 1,640 | 1,674 | 1,465 | 1,451 | 1,455 |
| 2013 | 1,272 | 1,156 | 1,352 | 1,043 | 1,155 | 1,554 | 1,524 | 1,496 | 1,513 | 1,516 | 1,361 | 1,457 |
| 2014 | 1,315 | 1,198 | 1,458 | 1,345 | 1,582 | 1,430 | 1,593 | 1,399 | 1,490 | 1,314 | 1,334 | 1,510 |
| 2015 | 1,277 | 1,382 | 1,540 | 1,321 | 1,171 | 1,243 | 1,214 | 1,686 | 1,624 | 1,384 | 1,530 | 1,482 |
| 2016 | 1,689 | 1,438 | 1,760 | 1,593 | 1,505 | 1,513 | 1,662 | 1,689 | 1,621 | 1,624 | 1,561 | 1,649 |
| 2017 | 1,574 | 1,356 | 1,410 | 1,276 | 1,535 | 1,448 | 1,563 | 1,656 | 1,609 | 1,283 | 1,382 | 1,443 |
| 2018 | 1,309 | 1,222 | 1,722 | 1,776 | 1,745 | 1,703 | 1,425 | 1,587 | 1,459 | 1,571 | 1,568 | 1,657 |
| 2019 | 1,421 | 1,427 | 1,532 | 1,322 | 1,258 | 1,241 | 1,566 | 1,656 | 1,640 | 1,638 | 1,506 | 1,607 |
| 2020 | 1,630 | 1,589 | 1,339 | 898 | 1,220 | 1,158 | 1,332 | 1,375 | 1,453 | 1,672 | 1,534 | 1,308 |
| 2021 | 1,371 | 1,108 | 1,465 | 1,146 | 1,367 | 1,613 | 1,635 | 1,631 | 1,392 | 1,629 | 1,719 | 1,821 |
| 2022 | 1,765 | 1,427 | 1,642 | 1,742 | 1,832 | 1,787 | 1,752 | 1,929 | 1,888 | 2,057 | 2,039 | 1,996 |
| 2023 | 1,773 | 1,649 | 1,703 | 1,450 | 1,703 | 1,869 | 1,934 | 1,819 | 1,869 | 2,127 | 1,826 | 2,130 |
| 2024 | 1,849 | 1,852 | 1,928 | 1,439 | ||||||||
| - = No Data Reported; -- = Not Applicable; NA = Not Available; W = Withheld to avoid disclosure of individual company data. |
| Release Date: 6/28/2024 |
| Next Release Date: 7/31/2024 |