|
Download Data (XLS File) |
|
||||||||
|
||||||||
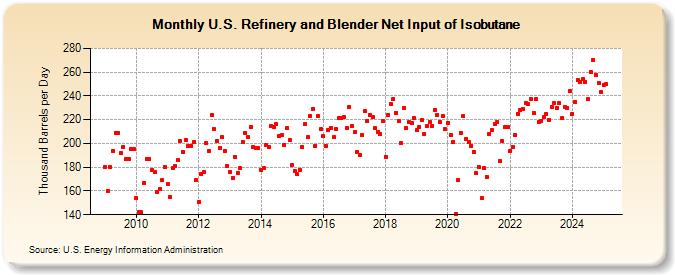
| U.S. Refinery and Blender Net Input of Isobutane (Thousand Barrels per Day) | ||||||||
| Year | Jan | Feb | Mar | Apr | May | Jun | Jul | Aug | Sep | Oct | Nov | Dec |
|---|---|---|---|---|---|---|---|---|---|---|---|---|
| 2009 | 180 | 160 | 180 | 194 | 209 | 209 | 192 | 197 | 187 | 187 | 195 | 195 |
| 2010 | 154 | 142 | 142 | 167 | 187 | 187 | 178 | 176 | 159 | 162 | 169 | 180 |
| 2011 | 166 | 155 | 179 | 181 | 186 | 202 | 193 | 203 | 198 | 198 | 201 | 169 |
| 2012 | 151 | 174 | 176 | 200 | 194 | 224 | 212 | 202 | 196 | 205 | 194 | 181 |
| 2013 | 176 | 171 | 189 | 175 | 179 | 201 | 209 | 205 | 214 | 197 | 196 | 196 |
| 2014 | 178 | 179 | 199 | 197 | 215 | 214 | 216 | 206 | 207 | 199 | 213 | 203 |
| 2015 | 182 | 177 | 174 | 178 | 197 | 216 | 205 | 223 | 229 | 198 | 223 | 212 |
| 2016 | 206 | 198 | 211 | 213 | 205 | 212 | 221 | 221 | 222 | 213 | 231 | 215 |
| 2017 | 210 | 193 | 190 | 207 | 227 | 219 | 224 | 222 | 213 | 210 | 208 | 219 |
| 2018 | 189 | 224 | 233 | 237 | 226 | 219 | 200 | 230 | 213 | 218 | 217 | 221 |
| 2019 | 211 | 214 | 220 | 208 | 215 | 218 | 215 | 228 | 224 | 218 | 223 | 212 |
| 2020 | 217 | 207 | 201 | 141 | 169 | 209 | 223 | 204 | 201 | 198 | 193 | 175 |
| 2021 | 180 | 154 | 179 | 172 | 208 | 211 | 216 | 218 | 185 | 202 | 214 | 214 |
| 2022 | 194 | 197 | 207 | 225 | 228 | 229 | 234 | 233 | 237 | 226 | 237 | 218 |
| 2023 | 219 | 222 | 225 | 220 | 231 | 234 | 230 | 234 | 221 | 231 | 230 | 244 |
| 2024 | 225 | |||||||||||
| - = No Data Reported; -- = Not Applicable; NA = Not Available; W = Withheld to avoid disclosure of individual company data. |
| Release Date: 3/29/2024 |
| Next Release Date: 4/30/2024 |