|
Download Data (XLS File) |
|
||||||||
|
||||||||
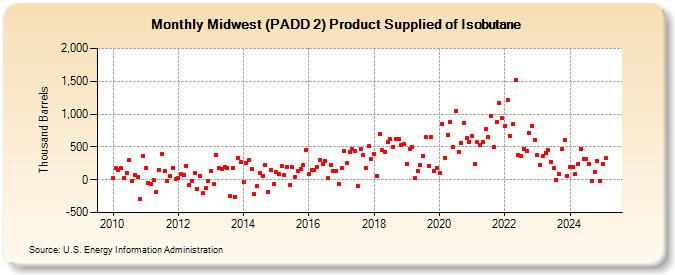
| Midwest (PADD 2) Product Supplied of Isobutane (Thousand Barrels) | ||||||||
| Year | Jan | Feb | Mar | Apr | May | Jun | Jul | Aug | Sep | Oct | Nov | Dec |
|---|---|---|---|---|---|---|---|---|---|---|---|---|
| 2010 | 23 | 177 | 148 | 173 | 26 | 110 | 299 | -18 | 78 | 35 | -290 | 356 |
| 2011 | 171 | -57 | -70 | -8 | -184 | 153 | 398 | 135 | -21 | 52 | 177 | 6 |
| 2012 | 19 | 85 | 69 | 215 | -73 | -16 | 110 | -136 | 64 | -205 | -132 | -14 |
| 2013 | 139 | -64 | 378 | 178 | 165 | 201 | 178 | -251 | 177 | -256 | 338 | 269 |
| 2014 | -40 | 261 | 304 | 168 | -219 | -97 | 103 | 64 | 217 | -184 | 155 | -66 |
| 2015 | 121 | 80 | 204 | 65 | 193 | -82 | 187 | 49 | 132 | 158 | 224 | 458 |
| 2016 | 81 | 150 | 144 | 194 | 301 | 232 | 289 | 24 | 217 | 128 | 139 | -72 |
| 2017 | 172 | 430 | 253 | 429 | 475 | 433 | -101 | 466 | 384 | 181 | 513 | 321 |
| 2018 | 398 | 63 | 699 | 456 | 424 | 573 | 620 | 505 | 624 | 619 | 525 | 540 |
| 2019 | 238 | 469 | 498 | 33 | 140 | 223 | 366 | 648 | 204 | 657 | 128 | 179 |
| 2020 | 95 | 850 | 335 | 688 | 881 | 498 | 1,043 | 425 | 566 | 871 | 638 | 576 |
| 2021 | 667 | 241 | 568 | 530 | 577 | 777 | 656 | 973 | 504 | 875 | 1,174 | 933 |
| 2022 | 815 | 1,218 | 668 | 843 | 1,512 | 383 | 363 | 461 | 436 | 710 | 825 | 601 |
| 2023 | 568 | 370 | 704 | 740 | 654 | 615 | 280 | 87 | 338 | 505 | 675 | 68 |
| 2024 | 195 | 188 | 131 | 246 | ||||||||
| - = No Data Reported; -- = Not Applicable; NA = Not Available; W = Withheld to avoid disclosure of individual company data. |
| Release Date: 6/28/2024 |
| Next Release Date: 7/31/2024 |