|
Download Data (XLS File) |
|
||||||||
|
||||||||
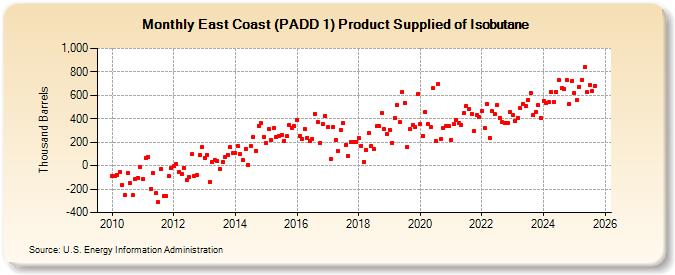
| East Coast (PADD 1) Product Supplied of Isobutane (Thousand Barrels) | ||||||||
| Year | Jan | Feb | Mar | Apr | May | Jun | Jul | Aug | Sep | Oct | Nov | Dec |
|---|---|---|---|---|---|---|---|---|---|---|---|---|
| 2010 | -90 | -86 | -76 | -52 | -166 | -250 | -61 | -152 | -254 | -117 | -102 | -8 |
| 2011 | -114 | 68 | 75 | -202 | -63 | -236 | -313 | -29 | -259 | -257 | -87 | -18 |
| 2012 | -6 | 14 | -53 | -75 | -17 | -119 | -101 | 96 | -86 | -80 | 89 | 157 |
| 2013 | 68 | 93 | -136 | 28 | 44 | 39 | -28 | 32 | 77 | 94 | 157 | 105 |
| 2014 | 112 | 165 | 96 | 50 | 146 | 9 | 168 | 245 | 129 | 342 | 361 | 248 |
| 2015 | 193 | 310 | 217 | 321 | 242 | 255 | 263 | 213 | 250 | 345 | 320 | 336 |
| 2016 | 392 | 251 | 229 | 312 | 238 | 206 | 231 | 437 | 374 | 193 | 357 | 422 |
| 2017 | 326 | 53 | 327 | 217 | 129 | 305 | 360 | 179 | 83 | 202 | 198 | 205 |
| 2018 | 240 | 170 | 32 | 137 | 278 | 166 | 143 | 335 | 334 | 449 | 309 | 272 |
| 2019 | 307 | 192 | 404 | 517 | 372 | 632 | 537 | 161 | 312 | 345 | 333 | 611 |
| 2020 | 353 | 256 | 458 | 356 | 327 | 662 | 207 | 697 | 228 | 325 | 335 | 340 |
| 2021 | 219 | 352 | 389 | 362 | 347 | 450 | 507 | 487 | 441 | 296 | 433 | 412 |
| 2022 | 468 | 324 | 526 | 238 | 467 | 437 | 518 | 410 | 369 | 363 | 367 | 458 |
| 2023 | 436 | 381 | 414 | 495 | 524 | 502 | 566 | 618 | 434 | 454 | 517 | 406 |
| 2024 | 456 | 428 | 384 | 507 | ||||||||
| - = No Data Reported; -- = Not Applicable; NA = Not Available; W = Withheld to avoid disclosure of individual company data. |
| Release Date: 6/28/2024 |
| Next Release Date: 7/31/2024 |