|
Download Data (XLS File) |
|
||||||||
|
||||||||
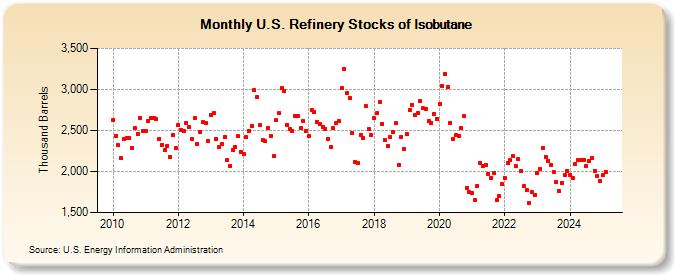
| U.S. Refinery Stocks of Isobutane (Thousand Barrels) | ||||||||
| Year | Jan | Feb | Mar | Apr | May | Jun | Jul | Aug | Sep | Oct | Nov | Dec |
|---|---|---|---|---|---|---|---|---|---|---|---|---|
| 2010 | 2,628 | 2,432 | 2,319 | 2,159 | 2,395 | 2,403 | 2,403 | 2,291 | 2,532 | 2,460 | 2,657 | 2,498 |
| 2011 | 2,497 | 2,613 | 2,654 | 2,651 | 2,636 | 2,402 | 2,328 | 2,260 | 2,316 | 2,180 | 2,444 | 2,281 |
| 2012 | 2,570 | 2,511 | 2,494 | 2,595 | 2,540 | 2,402 | 2,648 | 2,334 | 2,487 | 2,599 | 2,588 | 2,372 |
| 2013 | 2,689 | 2,714 | 2,398 | 2,296 | 2,330 | 2,420 | 2,145 | 2,071 | 2,261 | 2,299 | 2,428 | 2,240 |
| 2014 | 2,214 | 2,415 | 2,498 | 2,560 | 2,994 | 2,910 | 2,563 | 2,390 | 2,367 | 2,528 | 2,430 | 2,188 |
| 2015 | 2,623 | 2,708 | 3,020 | 2,985 | 2,572 | 2,514 | 2,494 | 2,678 | 2,681 | 2,525 | 2,615 | 2,495 |
| 2016 | 2,431 | 2,753 | 2,719 | 2,604 | 2,576 | 2,546 | 2,518 | 2,400 | 2,301 | 2,526 | 2,596 | 2,611 |
| 2017 | 3,015 | 3,250 | 2,954 | 2,894 | 2,469 | 2,114 | 2,105 | 2,445 | 2,408 | 2,794 | 2,519 | 2,450 |
| 2018 | 2,647 | 2,715 | 2,850 | 2,579 | 2,382 | 2,315 | 2,423 | 2,481 | 2,585 | 2,083 | 2,417 | 2,270 |
| 2019 | 2,451 | 2,749 | 2,814 | 2,694 | 2,715 | 2,858 | 2,773 | 2,758 | 2,612 | 2,597 | 2,700 | 2,643 |
| 2020 | 2,823 | 3,047 | 3,188 | 3,030 | 2,588 | 2,395 | 2,440 | 2,432 | 2,525 | 2,672 | 1,801 | 1,746 |
| 2021 | 1,735 | 1,659 | 1,829 | 2,109 | 2,064 | 2,081 | 1,970 | 1,925 | 1,985 | 1,651 | 1,700 | 1,845 |
| 2022 | 1,926 | 2,109 | 2,137 | 2,185 | 2,063 | 2,149 | 2,010 | 1,820 | 1,772 | 1,620 | 1,746 | 1,719 |
| 2023 | 1,976 | 2,025 | 2,292 | 2,165 | 2,133 | 2,082 | 1,993 | 1,871 | 1,757 | 1,865 | 1,960 | 2,007 |
| 2024 | 1,956 | |||||||||||
| - = No Data Reported; -- = Not Applicable; NA = Not Available; W = Withheld to avoid disclosure of individual company data. |
| Release Date: 3/29/2024 |
| Next Release Date: 4/30/2024 |