|
Download Data (XLS File) |
|
||||||||
|
||||||||
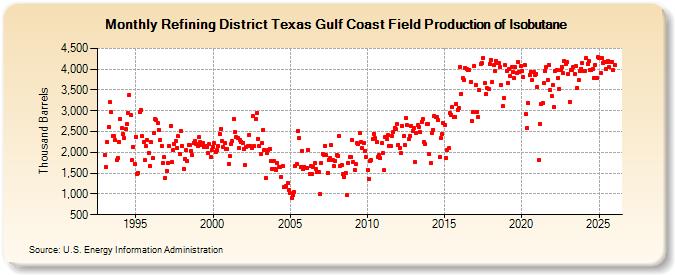
| Refining District Texas Gulf Coast Field Production of Isobutane (Thousand Barrels) | ||||||||
| Year | Jan | Feb | Mar | Apr | May | Jun | Jul | Aug | Sep | Oct | Nov | Dec |
|---|---|---|---|---|---|---|---|---|---|---|---|---|
| 1993 | 1,948 | 1,642 | 2,254 | 2,612 | 3,199 | 2,961 | 2,399 | 2,387 | 2,291 | 1,812 | 1,867 | 2,259 |
| 1994 | 2,799 | 2,578 | 2,432 | 2,339 | 2,563 | 2,686 | 2,958 | 3,385 | 2,898 | 1,805 | 2,139 | 1,727 |
| 1995 | 2,381 | 1,486 | 1,514 | 2,975 | 3,026 | 2,384 | 2,242 | 1,819 | 2,143 | 2,286 | 1,994 | 1,667 |
| 1996 | 2,237 | 1,855 | 2,460 | 2,791 | 2,767 | 2,697 | 2,545 | 2,305 | 2,162 | 1,748 | 1,876 | 1,394 |
| 1997 | 1,563 | 1,747 | 2,150 | 2,636 | 1,763 | 2,049 | 2,203 | 2,281 | 2,109 | 2,384 | 1,961 | 2,505 |
| 1998 | 2,154 | 1,604 | 1,836 | 2,053 | 1,791 | 2,179 | 2,177 | 2,029 | 1,939 | 2,234 | 2,276 | 2,205 |
| 1999 | 2,160 | 2,362 | 2,239 | 2,169 | 2,213 | 2,127 | 2,159 | 2,125 | 1,979 | 2,194 | 1,893 | 2,065 |
| 2000 | 2,132 | 2,222 | 2,017 | 2,048 | 2,157 | 2,444 | 2,567 | 2,271 | 2,126 | 2,224 | 2,085 | 2,075 |
| 2001 | 1,724 | 1,908 | 2,204 | 2,262 | 2,806 | 2,492 | 2,377 | 2,349 | 2,097 | 2,308 | 2,255 | 2,236 |
| 2002 | 2,069 | 1,685 | 2,139 | 2,141 | 2,411 | 2,155 | 2,107 | 2,876 | 2,147 | 2,806 | 2,958 | 2,325 |
| 2003 | 2,143 | 1,972 | 2,213 | 2,548 | 2,062 | 1,391 | 1,983 | 2,057 | 2,092 | 1,785 | 1,608 | 1,781 |
| 2004 | 1,601 | 1,585 | 1,743 | 1,647 | 1,651 | 1,403 | 1,679 | 1,165 | 1,173 | 1,181 | 1,259 | 1,102 |
| 2005 | 1,012 | 910 | 985 | 1,052 | 1,679 | 1,728 | 2,519 | 2,345 | 1,638 | 2,033 | 1,593 | 1,658 |
| 2006 | 1,630 | 1,613 | 2,055 | 1,481 | 1,662 | 1,482 | 1,654 | 1,735 | 1,594 | 1,527 | 1,535 | 994 |
| 2007 | 1,746 | 1,969 | 1,931 | 2,152 | 1,929 | 1,511 | 1,822 | 1,874 | 2,174 | 1,805 | 1,660 | 1,794 |
| 2008 | 1,946 | 1,911 | 2,391 | 1,679 | 1,693 | 1,471 | 1,401 | 1,510 | 964 | 1,753 | 1,893 | 1,890 |
| 2009 | 2,298 | 1,758 | 1,584 | 1,716 | 2,218 | 2,209 | 2,454 | 2,237 | 2,093 | 2,233 | 2,035 | 1,894 |
| 2010 | 1,571 | 1,354 | 1,787 | 1,827 | 2,313 | 2,449 | 2,334 | 2,249 | 1,880 | 1,927 | 1,857 | 2,213 |
| 2011 | 1,980 | 1,567 | 2,373 | 2,327 | 2,416 | 2,157 | 2,149 | 2,398 | 2,479 | 2,594 | 2,552 | 2,674 |
| 2012 | 2,188 | 2,116 | 1,978 | 2,636 | 2,389 | 2,186 | 2,837 | 2,648 | 2,309 | 2,391 | 2,645 | 2,508 |
| 2013 | 2,586 | 1,771 | 2,472 | 2,648 | 2,613 | 2,480 | 2,734 | 2,790 | 2,259 | 2,191 | 2,677 | 2,688 |
| 2014 | 1,953 | 1,743 | 2,474 | 2,547 | 2,871 | 2,857 | 2,838 | 2,776 | 1,878 | 2,338 | 2,436 | 2,706 |
| 2015 | 2,663 | 1,871 | 2,060 | 2,094 | 2,940 | 2,908 | 3,082 | 2,844 | 2,862 | 3,165 | 3,030 | 3,075 |
| 2016 | 4,042 | 3,413 | 3,783 | 3,751 | 4,032 | 3,999 | 3,988 | 3,987 | 3,690 | 2,753 | 2,960 | 4,082 |
| 2017 | 3,628 | 2,966 | 2,856 | 3,494 | 4,122 | 4,137 | 4,270 | 3,657 | 3,393 | 3,542 | 3,535 | 4,130 |
| 2018 | 4,220 | 3,693 | 4,094 | 3,963 | 4,201 | 4,153 | 4,146 | 4,041 | 3,629 | 3,103 | 3,310 | 4,091 |
| 2019 | 3,961 | 3,675 | 4,002 | 3,836 | 4,058 | 3,931 | 3,779 | 4,053 | 3,918 | 4,175 | 3,941 | 4,065 |
| 2020 | 3,968 | 3,801 | 4,101 | 2,914 | 2,587 | 3,184 | 3,865 | 3,932 | 3,744 | 3,923 | 3,851 | 3,891 |
| 2021 | 3,568 | 1,813 | 2,683 | 3,160 | 3,177 | 3,661 | 3,961 | 4,045 | 3,750 | 4,112 | 3,491 | 3,350 |
| 2022 | 3,610 | 3,091 | 3,968 | 3,976 | 3,793 | 3,524 | 3,973 | 4,063 | 3,906 | 4,194 | 4,130 | 4,167 |
| 2023 | 3,885 | 3,221 | 3,985 | 3,997 | 4,061 | 3,889 | 4,067 | 3,556 | 3,725 | 3,959 | 4,014 | 4,139 |
| 2024 | 3,954 | |||||||||||
| - = No Data Reported; -- = Not Applicable; NA = Not Available; W = Withheld to avoid disclosure of individual company data. |
| Release Date: 3/29/2024 |
| Next Release Date: 4/30/2024 |