|
Download Data (XLS File) |
|
||||||||
|
||||||||
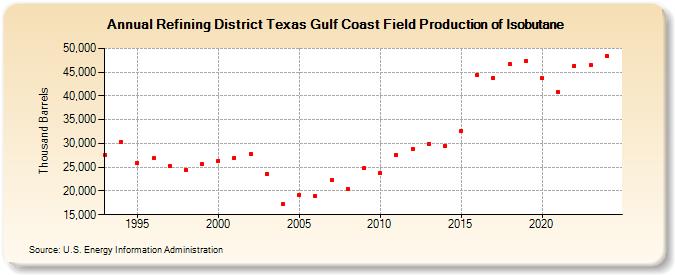
| Refining District Texas Gulf Coast Field Production of Isobutane (Thousand Barrels) | ||||||||
| Decade | Year-0 | Year-1 | Year-2 | Year-3 | Year-4 | Year-5 | Year-6 | Year-7 | Year-8 | Year-9 |
|---|---|---|---|---|---|---|---|---|---|---|
| 1990's | 27,631 | 30,309 | 25,917 | 26,837 | 25,351 | 24,477 | 25,685 | |||
| 2000's | 26,368 | 27,018 | 27,819 | 23,635 | 17,189 | 19,152 | 18,962 | 22,367 | 20,502 | 24,729 |
| 2010's | 23,761 | 27,666 | 28,831 | 29,909 | 29,417 | 32,594 | 44,480 | 43,730 | 46,644 | 47,394 |
| 2020's | 43,761 | 40,771 | 46,395 | 46,498 |
| - = No Data Reported; -- = Not Applicable; NA = Not Available; W = Withheld to avoid disclosure of individual company data. |
| Release Date: 6/28/2024 |
| Next Release Date: 8/30/2024 |