|
Download Data (XLS File) |
|
||||||||
|
||||||||
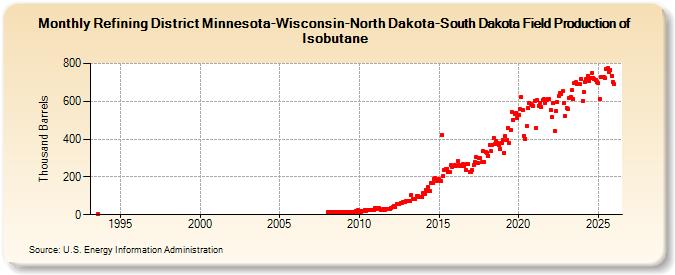
| Refining District Minnesota-Wisconsin-North Dakota-South Dakota Field Production of Isobutane (Thousand Barrels) | ||||||||
| Year | Jan | Feb | Mar | Apr | May | Jun | Jul | Aug | Sep | Oct | Nov | Dec |
|---|---|---|---|---|---|---|---|---|---|---|---|---|
| 1993 | 2 | |||||||||||
| 2008 | 13 | 11 | 12 | 13 | 14 | 13 | 12 | 14 | 12 | 15 | 14 | 8 |
| 2009 | 13 | 12 | 13 | 14 | 15 | 15 | 15 | 16 | 15 | 18 | 17 | 23 |
| 2010 | 19 | 16 | 22 | 22 | 24 | 22 | 27 | 23 | 27 | 25 | 26 | 24 |
| 2011 | 34 | 30 | 34 | 34 | 27 | 27 | 29 | 27 | 28 | 28 | 30 | 32 |
| 2012 | 33 | 42 | 47 | 42 | 56 | 57 | 56 | 61 | 61 | 67 | 69 | 71 |
| 2013 | 72 | 72 | 75 | 106 | 83 | 83 | 85 | 98 | 101 | 96 | 95 | 92 |
| 2014 | 117 | 110 | 132 | 126 | 146 | 124 | 167 | 170 | 189 | 194 | 178 | 187 |
| 2015 | 187 | 177 | 423 | 206 | 238 | 242 | 244 | 228 | 225 | 261 | 255 | 259 |
| 2016 | 261 | 260 | 285 | 264 | 259 | 256 | 269 | 256 | 239 | 269 | 267 | 226 |
| 2017 | 227 | 236 | 261 | 278 | 306 | 273 | 298 | 298 | 277 | 338 | 281 | 331 |
| 2018 | 328 | 311 | 370 | 335 | 369 | 407 | 373 | 390 | 381 | 368 | 349 | 382 |
| 2019 | 396 | 329 | 415 | 393 | 459 | 381 | 449 | 541 | 502 | 535 | 540 | 513 |
| 2020 | 527 | 558 | 623 | 554 | 418 | 403 | 471 | 564 | 592 | 584 | 581 | 577 |
| 2021 | 603 | 461 | 605 | 577 | 592 | 570 | 606 | 610 | 592 | 608 | 610 | 610 |
| 2022 | 556 | 515 | 590 | 445 | 549 | 598 | 627 | 642 | 641 | 652 | 591 | 522 |
| 2023 | 593 | 580 | 638 | 630 | 674 | 669 | 708 | 723 | 698 | 708 | 699 | 725 |
| 2024 | 603 | |||||||||||
| - = No Data Reported; -- = Not Applicable; NA = Not Available; W = Withheld to avoid disclosure of individual company data. |
| Release Date: 3/29/2024 |
| Next Release Date: 4/30/2024 |