|
Download Data (XLS File) |
|
||||||||
|
||||||||
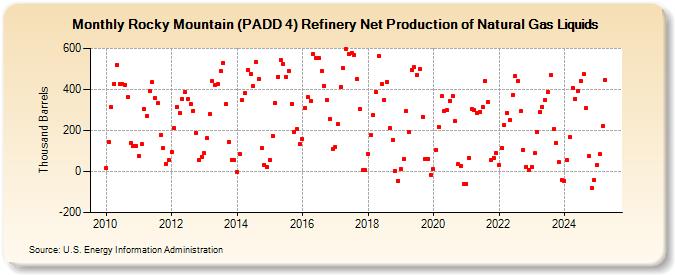
| Rocky Mountain (PADD 4) Refinery Net Production of Natural Gas Liquids (Thousand Barrels) | ||||||||
| Year | Jan | Feb | Mar | Apr | May | Jun | Jul | Aug | Sep | Oct | Nov | Dec |
|---|---|---|---|---|---|---|---|---|---|---|---|---|
| 2010 | 19 | 144 | 312 | 428 | 521 | 425 | 427 | 423 | 361 | 140 | 125 | 125 |
| 2011 | 78 | 132 | 303 | 271 | 390 | 436 | 357 | 335 | 180 | 114 | 38 | 55 |
| 2012 | 96 | 212 | 315 | 286 | 354 | 389 | 351 | 327 | 297 | 190 | 56 | 72 |
| 2013 | 88 | 162 | 278 | 442 | 420 | 425 | 492 | 529 | 329 | 145 | 57 | 56 |
| 2014 | -1 | 86 | 348 | 381 | 497 | 474 | 415 | 535 | 453 | 117 | 32 | 22 |
| 2015 | 58 | 175 | 333 | 463 | 545 | 523 | 462 | 491 | 331 | 195 | 207 | 134 |
| 2016 | 158 | 309 | 362 | 345 | 573 | 553 | 551 | 489 | 418 | 348 | 257 | 109 |
| 2017 | 119 | 231 | 412 | 503 | 596 | 573 | 579 | 568 | 449 | 305 | 5 | 6 |
| 2018 | 87 | 177 | 275 | 387 | 564 | 425 | 349 | 437 | 212 | 154 | 3 | -44 |
| 2019 | 14 | 61 | 294 | 193 | 496 | 507 | 472 | 498 | 267 | 61 | 61 | -15 |
| 2020 | 11 | 105 | 219 | 366 | 294 | 298 | 346 | 366 | 246 | 35 | 28 | -61 |
| 2021 | -59 | 67 | 305 | 300 | 283 | 292 | 315 | 440 | 338 | 55 | 68 | 90 |
| 2022 | 31 | 114 | 228 | 287 | 251 | 372 | 465 | 439 | 293 | 107 | 24 | 9 |
| 2023 | 21 | 88 | 194 | 291 | 316 | 348 | 386 | 471 | 208 | 139 | 45 | -40 |
| 2024 | -45 | 55 | 166 | 407 | 355 | 394 | 442 | 474 | 308 | 74 | -81 | -42 |
| 2025 | 32 | 84 | 220 | 447 | ||||||||
| - = No Data Reported; -- = Not Applicable; NA = Not Available; W = Withheld to avoid disclosure of individual company data. |
| Release Date: 6/30/2025 |
| Next Release Date: 7/31/2025 |