|
Download Data (XLS File) |
|
||||||||
|
||||||||
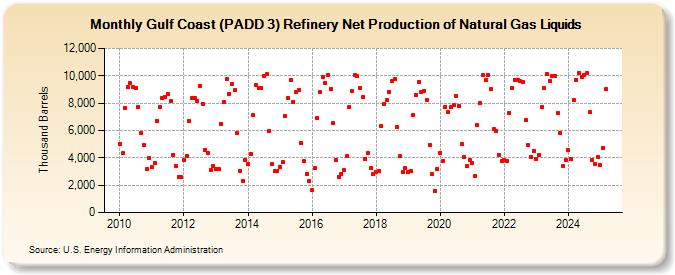
| Gulf Coast (PADD 3) Refinery Net Production of Natural Gas Liquids (Thousand Barrels) | ||||||||
| Year | Jan | Feb | Mar | Apr | May | Jun | Jul | Aug | Sep | Oct | Nov | Dec |
|---|---|---|---|---|---|---|---|---|---|---|---|---|
| 2010 | 5,042 | 4,322 | 7,671 | 9,199 | 9,448 | 9,174 | 9,099 | 7,728 | 5,832 | 4,945 | 3,205 | 3,978 |
| 2011 | 3,300 | 3,627 | 6,717 | 7,710 | 8,360 | 8,479 | 8,666 | 8,119 | 4,236 | 3,372 | 2,583 | 2,580 |
| 2012 | 3,815 | 4,150 | 6,682 | 8,377 | 8,390 | 8,187 | 9,283 | 7,956 | 4,597 | 4,325 | 3,129 | 3,417 |
| 2013 | 3,150 | 3,157 | 6,464 | 8,080 | 9,730 | 8,660 | 9,432 | 8,929 | 5,783 | 3,043 | 2,302 | 3,835 |
| 2014 | 3,566 | 4,312 | 7,158 | 9,310 | 9,115 | 9,108 | 9,946 | 10,099 | 5,993 | 3,529 | 3,012 | 3,022 |
| 2015 | 3,354 | 3,662 | 7,057 | 8,372 | 9,680 | 8,095 | 8,809 | 8,926 | 5,093 | 3,784 | 2,817 | 2,315 |
| 2016 | 1,640 | 3,249 | 6,886 | 8,792 | 9,910 | 9,493 | 10,088 | 9,026 | 6,511 | 3,810 | 2,600 | 2,788 |
| 2017 | 3,091 | 4,121 | 7,705 | 8,854 | 10,032 | 9,975 | 9,113 | 8,464 | 3,940 | 4,341 | 3,268 | 2,799 |
| 2018 | 2,953 | 3,048 | 6,335 | 7,922 | 8,263 | 8,840 | 9,648 | 9,730 | 6,227 | 4,110 | 2,992 | 3,258 |
| 2019 | 2,977 | 3,025 | 7,119 | 8,626 | 9,559 | 8,821 | 8,896 | 8,262 | 4,970 | 2,837 | 1,595 | 3,193 |
| 2020 | 4,366 | 3,804 | 7,735 | 7,333 | 7,704 | 7,845 | 8,513 | 7,811 | 5,023 | 4,066 | 3,392 | 3,857 |
| 2021 | 3,612 | 2,687 | 6,392 | 7,998 | 10,022 | 9,701 | 10,060 | 9,000 | 6,084 | 5,996 | 4,228 | 3,805 |
| 2022 | 3,817 | 3,796 | 7,303 | 9,101 | 9,726 | 9,693 | 9,582 | 9,513 | 6,750 | 4,921 | 4,077 | 4,507 |
| 2023 | 3,932 | 4,217 | 7,725 | 9,114 | 10,156 | 9,610 | 9,976 | 9,956 | 7,292 | 5,912 | 3,390 | 3,871 |
| 2024 | 4,542 | 3,941 | 8,223 | 9,725 | ||||||||
| - = No Data Reported; -- = Not Applicable; NA = Not Available; W = Withheld to avoid disclosure of individual company data. |
| Release Date: 6/28/2024 |
| Next Release Date: 7/31/2024 |