|
Download Data (XLS File) |
|
||||||||
|
||||||||
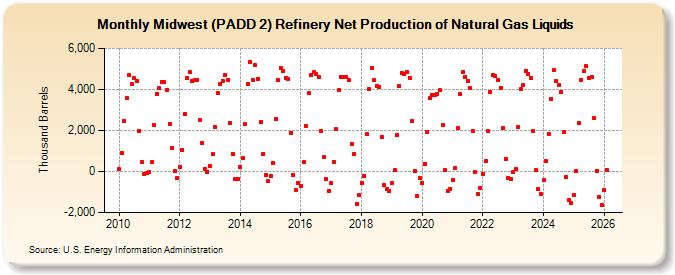
| Midwest (PADD 2) Refinery Net Production of Natural Gas Liquids (Thousand Barrels) | ||||||||
| Year | Jan | Feb | Mar | Apr | May | Jun | Jul | Aug | Sep | Oct | Nov | Dec |
|---|---|---|---|---|---|---|---|---|---|---|---|---|
| 2010 | 122 | 922 | 2,460 | 3,570 | 4,689 | 4,266 | 4,570 | 4,405 | 1,976 | 468 | -112 | -63 |
| 2011 | -5 | 471 | 2,259 | 3,797 | 4,056 | 4,348 | 4,374 | 3,977 | 2,316 | 1,167 | 1 | -332 |
| 2012 | 213 | 1,048 | 2,801 | 4,551 | 4,827 | 4,411 | 4,447 | 4,463 | 2,511 | 1,385 | 136 | -4 |
| 2013 | 257 | 835 | 2,162 | 3,804 | 4,256 | 4,429 | 4,685 | 4,443 | 2,365 | 868 | -349 | -355 |
| 2014 | 225 | 659 | 2,296 | 4,272 | 5,342 | 4,478 | 5,172 | 4,524 | 2,437 | 858 | -153 | -465 |
| 2015 | -221 | 393 | 2,540 | 4,466 | 5,065 | 4,886 | 4,554 | 4,496 | 1,892 | -163 | -894 | -576 |
| 2016 | -684 | 443 | 2,222 | 3,810 | 4,685 | 4,838 | 4,732 | 4,597 | 1,978 | 694 | -379 | -943 |
| 2017 | -573 | 475 | 2,052 | 3,959 | 4,614 | 4,615 | 4,586 | 4,443 | 1,345 | 869 | -1,584 | -1,128 |
| 2018 | -544 | -241 | 1,806 | 4,007 | 5,052 | 4,451 | 4,188 | 4,126 | 1,687 | -670 | -872 | -927 |
| 2019 | -553 | 68 | 1,800 | 4,186 | 4,788 | 4,748 | 4,830 | 4,569 | 2,443 | 17 | -1,193 | -311 |
| 2020 | -552 | 380 | 1,949 | 3,580 | 3,713 | 3,724 | 3,800 | 3,954 | 2,253 | 54 | -932 | -857 |
| 2021 | -411 | 180 | 2,111 | 3,789 | 4,826 | 4,620 | 4,411 | 4,053 | 1,961 | -43 | -1,073 | -790 |
| 2022 | -118 | 496 | 1,986 | 3,873 | 4,714 | 4,636 | 4,436 | 4,084 | 2,144 | 632 | -309 | -354 |
| 2023 | -36 | 131 | 2,156 | 3,995 | 4,181 | 4,892 | 4,757 | 4,541 | 1,967 | 54 | -865 | -1,081 |
| 2024 | -453 | |||||||||||
| - = No Data Reported; -- = Not Applicable; NA = Not Available; W = Withheld to avoid disclosure of individual company data. |
| Release Date: 3/29/2024 |
| Next Release Date: 4/30/2024 |