|
Download Data (XLS File) |
|
||||||||
|
||||||||
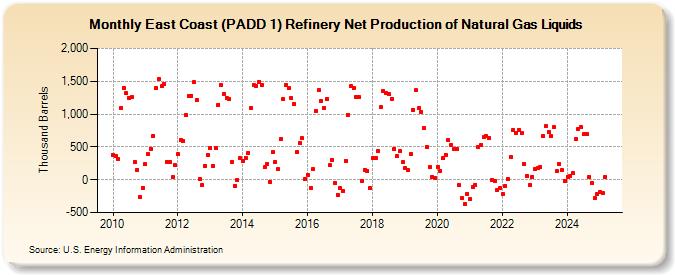
| East Coast (PADD 1) Refinery Net Production of Natural Gas Liquids (Thousand Barrels) | ||||||||
| Year | Jan | Feb | Mar | Apr | May | Jun | Jul | Aug | Sep | Oct | Nov | Dec |
|---|---|---|---|---|---|---|---|---|---|---|---|---|
| 2010 | 384 | 357 | 314 | 1,096 | 1,401 | 1,314 | 1,252 | 1,263 | 270 | 155 | -260 | -119 |
| 2011 | 235 | 386 | 473 | 666 | 1,395 | 1,535 | 1,427 | 1,464 | 273 | 265 | 37 | 219 |
| 2012 | 389 | 603 | 587 | 990 | 1,281 | 1,282 | 1,483 | 1,211 | 13 | -80 | 215 | 375 |
| 2013 | 484 | 209 | 479 | 1,144 | 1,441 | 1,312 | 1,249 | 1,233 | 275 | -90 | -2 | 325 |
| 2014 | 285 | 335 | 408 | 1,093 | 1,441 | 1,427 | 1,492 | 1,446 | 189 | 244 | -34 | 420 |
| 2015 | 273 | 156 | 614 | 1,227 | 1,448 | 1,392 | 1,238 | 1,154 | 422 | 564 | 630 | 5 |
| 2016 | 79 | -126 | 158 | 1,045 | 1,362 | 1,198 | 1,090 | 1,226 | 217 | 305 | -51 | -229 |
| 2017 | -129 | -170 | 289 | 993 | 1,423 | 1,393 | 1,257 | 1,259 | -12 | 152 | 131 | -123 |
| 2018 | 334 | 324 | 442 | 1,100 | 1,354 | 1,320 | 1,311 | 1,234 | 470 | 359 | 430 | 264 |
| 2019 | 182 | 145 | 386 | 1,061 | 1,362 | 1,086 | 1,030 | 781 | 496 | 195 | 46 | 28 |
| 2020 | 199 | 136 | 326 | 379 | 605 | 534 | 470 | 467 | -82 | -279 | -377 | -217 |
| 2021 | -293 | -107 | -74 | 502 | 525 | 645 | 665 | 632 | -4 | -15 | -150 | -132 |
| 2022 | -214 | -97 | 18 | 339 | 757 | 715 | 759 | 712 | 247 | 63 | -75 | 49 |
| 2023 | 165 | 171 | 192 | 670 | 814 | 731 | 664 | 798 | 127 | 246 | 147 | -15 |
| 2024 | 49 | |||||||||||
| - = No Data Reported; -- = Not Applicable; NA = Not Available; W = Withheld to avoid disclosure of individual company data. |
| Release Date: 3/29/2024 |
| Next Release Date: 4/30/2024 |