|
Download Data (XLS File) |
|
||||||||
|
||||||||
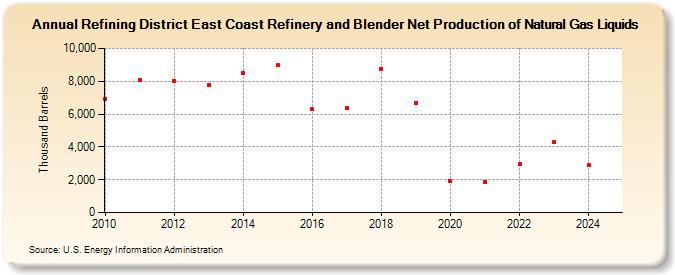
| Refining District East Coast Refinery and Blender Net Production of Natural Gas Liquids (Thousand Barrels) | ||||||||
| Decade | Year-0 | Year-1 | Year-2 | Year-3 | Year-4 | Year-5 | Year-6 | Year-7 | Year-8 | Year-9 |
|---|---|---|---|---|---|---|---|---|---|---|
| 2010's | 6,946 | 8,062 | 8,018 | 7,785 | 8,479 | 8,969 | 6,278 | 6,372 | 8,750 | 6,646 |
| 2020's | 1,899 | 1,874 | 2,939 | 4,306 |
| - = No Data Reported; -- = Not Applicable; NA = Not Available; W = Withheld to avoid disclosure of individual company data. |
| Release Date: 3/29/2024 |
| Next Release Date: 8/30/2024 |