|
Download Data (XLS File) |
|
||||||||
|
||||||||
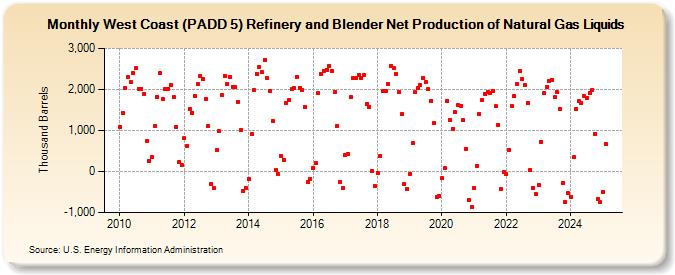
| West Coast (PADD 5) Refinery and Blender Net Production of Natural Gas Liquids (Thousand Barrels) | ||||||||
| Year | Jan | Feb | Mar | Apr | May | Jun | Jul | Aug | Sep | Oct | Nov | Dec |
|---|---|---|---|---|---|---|---|---|---|---|---|---|
| 2010 | 1,096 | 1,424 | 2,039 | 2,311 | 2,171 | 2,395 | 2,520 | 2,009 | 2,020 | 1,900 | 747 | 267 |
| 2011 | 357 | 1,102 | 1,815 | 2,389 | 1,771 | 2,022 | 2,020 | 2,119 | 1,816 | 1,089 | 229 | 159 |
| 2012 | 808 | 623 | 1,524 | 1,433 | 1,831 | 2,125 | 2,335 | 2,248 | 1,776 | 1,108 | -295 | -401 |
| 2013 | 522 | 981 | 1,865 | 2,333 | 2,143 | 2,314 | 2,067 | 2,049 | 1,704 | 1,012 | -470 | -390 |
| 2014 | -192 | 912 | 1,982 | 2,384 | 2,550 | 2,422 | 2,713 | 2,270 | 1,968 | 1,236 | 43 | -55 |
| 2015 | 383 | 288 | 1,658 | 1,738 | 2,002 | 2,026 | 2,306 | 2,047 | 1,982 | 1,571 | -259 | -174 |
| 2016 | 95 | 204 | 1,906 | 2,386 | 2,450 | 2,475 | 2,578 | 2,442 | 1,933 | 1,110 | -255 | -404 |
| 2017 | 404 | 439 | 1,816 | 2,290 | 2,283 | 2,351 | 2,288 | 2,343 | 1,648 | 1,568 | 8 | -353 |
| 2018 | -26 | 383 | 1,951 | 1,952 | 2,121 | 2,583 | 2,520 | 2,376 | 1,943 | 1,412 | -313 | -415 |
| 2019 | -56 | 685 | 1,930 | 2,035 | 2,103 | 2,290 | 2,177 | 2,005 | 1,726 | 1,187 | -627 | -596 |
| 2020 | -165 | 78 | 1,722 | 1,259 | 1,048 | 1,439 | 1,609 | 1,604 | 1,245 | 559 | -691 | -872 |
| 2021 | -391 | 129 | 1,405 | 1,748 | 1,897 | 1,926 | 1,923 | 1,971 | 1,588 | 1,145 | -437 | -19 |
| 2022 | -65 | 521 | 1,597 | 1,830 | 2,129 | 2,438 | 2,245 | 2,103 | 1,663 | 33 | -401 | -547 |
| 2023 | -329 | 721 | 1,908 | 2,051 | 2,200 | 2,241 | 1,804 | 1,932 | 1,534 | -278 | -750 | -532 |
| 2024 | -613 | |||||||||||
| - = No Data Reported; -- = Not Applicable; NA = Not Available; W = Withheld to avoid disclosure of individual company data. |
| Release Date: 3/29/2024 |
| Next Release Date: 4/30/2024 |