|
Download Data (XLS File) |
|
||||||||
|
||||||||
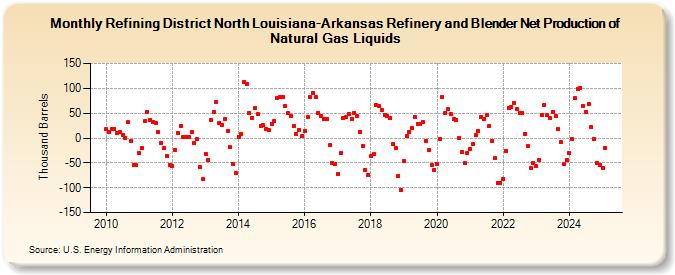
| Refining District North Louisiana-Arkansas Refinery and Blender Net Production of Natural Gas Liquids (Thousand Barrels) | ||||||||
| Year | Jan | Feb | Mar | Apr | May | Jun | Jul | Aug | Sep | Oct | Nov | Dec |
|---|---|---|---|---|---|---|---|---|---|---|---|---|
| 2010 | 18 | 12 | 18 | 18 | 10 | 12 | 6 | 1 | 32 | -5 | -54 | -55 |
| 2011 | -30 | -20 | 34 | 53 | 37 | 32 | 31 | 12 | -11 | -20 | -37 | -55 |
| 2012 | -56 | -24 | 10 | 24 | 3 | 2 | 2 | 12 | -11 | -2 | -59 | -83 |
| 2013 | -32 | -44 | 37 | 53 | 72 | 31 | 27 | 38 | 15 | -19 | -52 | -71 |
| 2014 | 3 | 8 | 113 | 109 | 50 | 41 | 61 | 48 | 25 | 26 | 19 | 16 |
| 2015 | 29 | 34 | 80 | 83 | 83 | 65 | 50 | 45 | 24 | 9 | 17 | 5 |
| 2016 | 14 | 43 | 82 | 91 | 82 | 51 | 44 | 38 | 39 | -15 | -50 | -52 |
| 2017 | -72 | -31 | 40 | 43 | 48 | 38 | 51 | 44 | 13 | -17 | -64 | -74 |
| 2018 | -37 | -33 | 66 | 64 | 56 | 46 | 44 | 40 | -13 | -21 | -76 | -104 |
| 2019 | -47 | 4 | 13 | 20 | 43 | 29 | 28 | 32 | -6 | -25 | -54 | -64 |
| 2020 | -52 | -1 | 82 | 51 | 58 | 48 | 38 | 37 | 0 | -28 | -51 | -31 |
| 2021 | -22 | -13 | 6 | 14 | 43 | 39 | 46 | 25 | -5 | -41 | -90 | -90 |
| 2022 | -82 | -26 | 60 | 62 | 71 | 59 | 51 | 50 | 9 | -16 | -61 | -51 |
| 2023 | -57 | -44 | 47 | 67 | 46 | 40 | 53 | 44 | 18 | -9 | -52 | -44 |
| 2024 | -31 | -2 | 80 | 99 | ||||||||
| - = No Data Reported; -- = Not Applicable; NA = Not Available; W = Withheld to avoid disclosure of individual company data. |
| Release Date: 6/28/2024 |
| Next Release Date: 7/31/2024 |