|
Download Data (XLS File) |
|
||||||||
|
||||||||
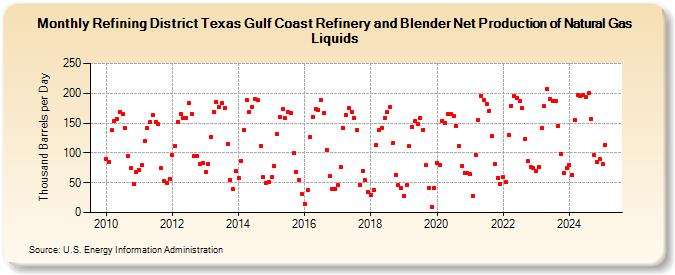
| Refining District Texas Gulf Coast Refinery and Blender Net Production of Natural Gas Liquids (Thousand Barrels per Day) | ||||||||
| Year | Jan | Feb | Mar | Apr | May | Jun | Jul | Aug | Sep | Oct | Nov | Dec |
|---|---|---|---|---|---|---|---|---|---|---|---|---|
| 2010 | 90 | 84 | 138 | 154 | 157 | 169 | 165 | 141 | 95 | 74 | 48 | 68 |
| 2011 | 71 | 79 | 120 | 142 | 152 | 164 | 152 | 148 | 74 | 53 | 50 | 57 |
| 2012 | 97 | 112 | 152 | 165 | 158 | 159 | 183 | 166 | 95 | 95 | 82 | 83 |
| 2013 | 68 | 82 | 126 | 169 | 186 | 177 | 183 | 176 | 115 | 55 | 39 | 69 |
| 2014 | 58 | 87 | 139 | 188 | 169 | 177 | 191 | 188 | 112 | 59 | 50 | 51 |
| 2015 | 59 | 78 | 131 | 161 | 173 | 158 | 168 | 167 | 100 | 68 | 54 | 31 |
| 2016 | 15 | 37 | 127 | 161 | 173 | 172 | 188 | 167 | 105 | 61 | 40 | 40 |
| 2017 | 46 | 77 | 142 | 163 | 175 | 169 | 159 | 139 | 47 | 70 | 54 | 35 |
| 2018 | 30 | 38 | 113 | 138 | 142 | 159 | 169 | 177 | 116 | 63 | 46 | 42 |
| 2019 | 28 | 46 | 111 | 144 | 153 | 149 | 159 | 139 | 79 | 41 | 10 | 42 |
| 2020 | 83 | 79 | 154 | 151 | 166 | 165 | 162 | 145 | 112 | 78 | 67 | 66 |
| 2021 | 64 | 28 | 97 | 156 | 196 | 189 | 182 | 171 | 128 | 82 | 58 | 48 |
| 2022 | 60 | 51 | 130 | 179 | 195 | 192 | 187 | 176 | 124 | 86 | 77 | 74 |
| 2023 | 70 | 77 | 141 | 178 | 207 | 191 | 187 | 187 | 145 | 102 | 66 | 74 |
| 2024 | 80 | |||||||||||
| - = No Data Reported; -- = Not Applicable; NA = Not Available; W = Withheld to avoid disclosure of individual company data. |
| Release Date: 3/29/2024 |
| Next Release Date: 4/30/2024 |