|
Download Data (XLS File) |
|
||||||||
|
||||||||
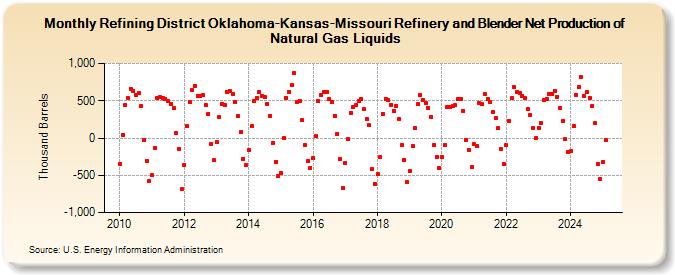
| Refining District Oklahoma-Kansas-Missouri Refinery and Blender Net Production of Natural Gas Liquids (Thousand Barrels) | ||||||||
| Year | Jan | Feb | Mar | Apr | May | Jun | Jul | Aug | Sep | Oct | Nov | Dec |
|---|---|---|---|---|---|---|---|---|---|---|---|---|
| 2010 | -346 | 46 | 449 | 537 | 658 | 634 | 576 | 603 | 431 | -27 | -311 | -572 |
| 2011 | -500 | -131 | 534 | 555 | 532 | 525 | 492 | 462 | 400 | 70 | -147 | -690 |
| 2012 | -366 | 161 | 483 | 638 | 702 | 570 | 558 | 575 | 438 | 326 | -83 | -295 |
| 2013 | -52 | 276 | 460 | 442 | 624 | 626 | 596 | 481 | 295 | 75 | -281 | -363 |
| 2014 | -163 | 159 | 491 | 541 | 623 | 564 | 551 | 459 | 301 | -65 | -317 | -512 |
| 2015 | -469 | -2 | 543 | 623 | 714 | 868 | 489 | 497 | 240 | -97 | -311 | -402 |
| 2016 | -265 | 21 | 490 | 574 | 613 | 613 | 522 | 483 | 300 | 58 | -288 | -674 |
| 2017 | -335 | -16 | 339 | 412 | 438 | 499 | 526 | 386 | 252 | 171 | -416 | -613 |
| 2018 | -484 | -261 | 326 | 530 | 506 | 448 | 369 | 436 | 257 | -96 | -292 | -592 |
| 2019 | -441 | -102 | 129 | 451 | 573 | 516 | 465 | 399 | 283 | -92 | -250 | -403 |
| 2020 | -256 | -99 | 417 | 412 | 423 | 438 | 523 | 519 | 363 | -21 | -155 | -393 |
| 2021 | -86 | -106 | 466 | 451 | 585 | 524 | 482 | 344 | 268 | 134 | -153 | -349 |
| 2022 | -100 | 227 | 533 | 681 | 622 | 603 | 568 | 531 | 396 | 313 | 133 | 0 |
| 2023 | 130 | 197 | 511 | 525 | 595 | 595 | 632 | 556 | 401 | 222 | -18 | -185 |
| 2024 | -180 | |||||||||||
| - = No Data Reported; -- = Not Applicable; NA = Not Available; W = Withheld to avoid disclosure of individual company data. |
| Release Date: 3/29/2024 |
| Next Release Date: 4/30/2024 |