|
Download Data (XLS File) |
|
||||||||
|
||||||||
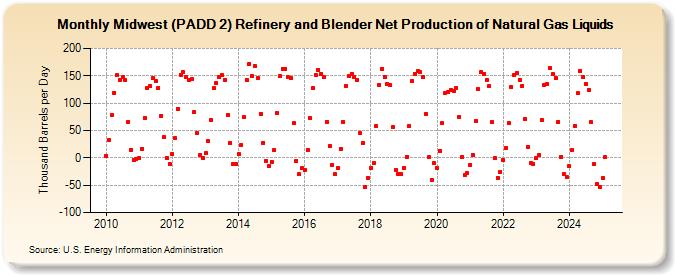
| Midwest (PADD 2) Refinery and Blender Net Production of Natural Gas Liquids (Thousand Barrels per Day) | ||||||||
| Year | Jan | Feb | Mar | Apr | May | Jun | Jul | Aug | Sep | Oct | Nov | Dec |
|---|---|---|---|---|---|---|---|---|---|---|---|---|
| 2010 | 4 | 33 | 79 | 119 | 151 | 142 | 147 | 142 | 66 | 15 | -4 | -2 |
| 2011 | 0 | 17 | 73 | 127 | 131 | 145 | 141 | 128 | 77 | 38 | 0 | -11 |
| 2012 | 7 | 36 | 90 | 152 | 156 | 147 | 143 | 144 | 84 | 45 | 5 | 0 |
| 2013 | 8 | 30 | 70 | 127 | 137 | 148 | 151 | 143 | 79 | 28 | -12 | -11 |
| 2014 | 7 | 24 | 74 | 142 | 172 | 149 | 167 | 146 | 81 | 28 | -5 | -15 |
| 2015 | -7 | 14 | 82 | 149 | 163 | 163 | 147 | 145 | 63 | -5 | -30 | -19 |
| 2016 | -22 | 15 | 72 | 127 | 151 | 161 | 153 | 148 | 66 | 22 | -13 | -30 |
| 2017 | -18 | 17 | 66 | 132 | 149 | 154 | 148 | 143 | 45 | 28 | -53 | -36 |
| 2018 | -18 | -9 | 58 | 134 | 163 | 148 | 135 | 133 | 56 | -22 | -29 | -30 |
| 2019 | -18 | 2 | 58 | 140 | 154 | 158 | 156 | 147 | 81 | 1 | -40 | -10 |
| 2020 | -18 | 13 | 63 | 119 | 120 | 124 | 123 | 128 | 75 | 2 | -31 | -28 |
| 2021 | -13 | 6 | 68 | 126 | 156 | 154 | 142 | 131 | 65 | -1 | -36 | -25 |
| 2022 | -4 | 18 | 64 | 129 | 152 | 155 | 143 | 132 | 71 | 20 | -10 | -11 |
| 2023 | -1 | 5 | 70 | 133 | 135 | 163 | 153 | 146 | 66 | 2 | -29 | -35 |
| 2024 | -15 | |||||||||||
| - = No Data Reported; -- = Not Applicable; NA = Not Available; W = Withheld to avoid disclosure of individual company data. |
| Release Date: 3/29/2024 |
| Next Release Date: 4/30/2024 |