|
Download Data (XLS File) |
|
||||||||
|
||||||||
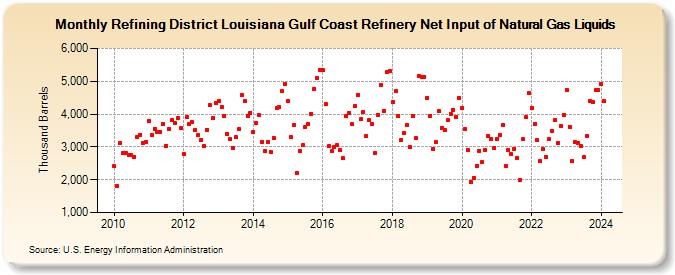
| Refining District Louisiana Gulf Coast Refinery Net Input of Natural Gas Liquids (Thousand Barrels) | ||||||||
| Year | Jan | Feb | Mar | Apr | May | Jun | Jul | Aug | Sep | Oct | Nov | Dec |
|---|---|---|---|---|---|---|---|---|---|---|---|---|
| 2010 | 2,403 | 1,821 | 3,118 | 2,805 | 2,828 | 2,746 | 2,757 | 2,706 | 3,302 | 3,374 | 3,133 | 3,154 |
| 2011 | 3,774 | 3,357 | 3,560 | 3,462 | 3,451 | 3,698 | 3,040 | 3,556 | 3,809 | 3,716 | 3,872 | 3,577 |
| 2012 | 2,787 | 3,900 | 3,687 | 3,751 | 3,509 | 3,353 | 3,198 | 3,034 | 3,526 | 4,267 | 3,870 | 4,339 |
| 2013 | 4,400 | 4,209 | 3,951 | 3,388 | 3,229 | 2,954 | 3,289 | 3,533 | 4,577 | 4,396 | 3,950 | 4,045 |
| 2014 | 3,461 | 3,716 | 3,974 | 3,160 | 2,868 | 3,149 | 2,857 | 3,281 | 4,174 | 4,201 | 4,690 | 4,914 |
| 2015 | 4,406 | 3,289 | 3,662 | 2,192 | 2,862 | 3,045 | 3,608 | 3,696 | 4,017 | 4,777 | 5,090 | 5,355 |
| 2016 | 5,334 | 4,293 | 3,015 | 2,860 | 3,001 | 3,068 | 2,898 | 2,647 | 3,948 | 4,039 | 3,689 | 4,236 |
| 2017 | 4,592 | 3,838 | 4,057 | 3,337 | 3,808 | 3,699 | 2,819 | 3,985 | 4,872 | 4,093 | 5,270 | 5,305 |
| 2018 | 4,363 | 4,713 | 3,928 | 3,199 | 3,422 | 3,664 | 2,997 | 3,941 | 3,270 | 5,155 | 5,137 | 5,139 |
| 2019 | 4,496 | 3,946 | 2,930 | 3,139 | 4,087 | 3,590 | 3,502 | 3,804 | 4,004 | 4,130 | 3,914 | 4,500 |
| 2020 | 4,190 | 3,554 | 2,891 | 1,942 | 2,067 | 2,422 | 2,881 | 2,532 | 2,902 | 3,334 | 3,240 | 2,955 |
| 2021 | 3,243 | 3,362 | 3,665 | 2,418 | 2,913 | 2,775 | 2,950 | 2,649 | 1,992 | 3,226 | 3,897 | 4,634 |
| 2022 | 4,196 | 3,700 | 3,199 | 2,561 | 2,926 | 2,703 | 3,229 | 3,492 | 3,808 | 3,126 | 3,641 | 3,972 |
| 2023 | 4,737 | 3,614 | 2,568 | 3,146 | 3,130 | 3,018 | 2,682 | 3,332 | 4,389 | 4,360 | 4,725 | 4,737 |
| 2024 | 4,919 | |||||||||||
| - = No Data Reported; -- = Not Applicable; NA = Not Available; W = Withheld to avoid disclosure of individual company data. |
| Release Date: 3/29/2024 |
| Next Release Date: 4/30/2024 |