|
Download Data (XLS File) |
|
||||||||
|
||||||||
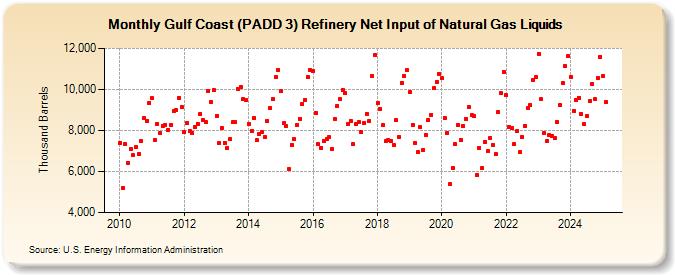
| Gulf Coast (PADD 3) Refinery Net Input of Natural Gas Liquids (Thousand Barrels) | ||||||||
| Year | Jan | Feb | Mar | Apr | May | Jun | Jul | Aug | Sep | Oct | Nov | Dec |
|---|---|---|---|---|---|---|---|---|---|---|---|---|
| 2010 | 7,403 | 5,221 | 7,342 | 6,427 | 7,081 | 6,787 | 7,181 | 6,848 | 7,484 | 8,606 | 8,475 | 9,359 |
| 2011 | 9,562 | 7,538 | 8,339 | 7,884 | 8,237 | 8,279 | 8,025 | 8,288 | 8,932 | 8,984 | 9,603 | 9,148 |
| 2012 | 7,911 | 8,368 | 7,967 | 7,887 | 8,167 | 8,323 | 8,813 | 8,511 | 8,403 | 9,915 | 9,373 | 9,960 |
| 2013 | 8,726 | 7,399 | 8,130 | 7,403 | 7,158 | 7,565 | 8,391 | 8,392 | 10,000 | 10,108 | 9,526 | 9,486 |
| 2014 | 8,333 | 7,990 | 8,606 | 7,514 | 7,838 | 7,928 | 7,686 | 8,467 | 9,093 | 9,520 | 10,610 | 10,967 |
| 2015 | 9,919 | 8,350 | 8,211 | 6,108 | 7,313 | 7,572 | 8,278 | 8,575 | 9,293 | 9,504 | 10,619 | 10,939 |
| 2016 | 10,890 | 8,862 | 7,323 | 7,168 | 7,501 | 7,585 | 7,667 | 7,101 | 8,565 | 9,202 | 9,512 | 9,975 |
| 2017 | 9,803 | 8,324 | 8,471 | 7,317 | 8,320 | 8,404 | 7,903 | 8,385 | 8,819 | 8,468 | 10,642 | 11,657 |
| 2018 | 9,344 | 9,042 | 8,254 | 7,475 | 7,531 | 7,481 | 7,298 | 8,492 | 7,691 | 10,315 | 10,651 | 10,945 |
| 2019 | 9,853 | 8,286 | 7,403 | 6,931 | 8,151 | 7,066 | 7,793 | 8,508 | 8,770 | 10,046 | 10,371 | 10,763 |
| 2020 | 10,539 | 8,622 | 7,895 | 5,384 | 6,181 | 7,328 | 8,258 | 7,527 | 8,212 | 8,583 | 9,149 | 8,737 |
| 2021 | 8,684 | 5,822 | 7,166 | 6,176 | 7,428 | 6,986 | 7,653 | 7,306 | 6,856 | 8,892 | 9,807 | 10,860 |
| 2022 | 9,708 | 8,171 | 8,104 | 7,334 | 7,955 | 6,930 | 7,679 | 8,233 | 9,078 | 9,251 | 10,483 | 10,595 |
| 2023 | 11,744 | 9,512 | 7,891 | 7,468 | 7,784 | 7,732 | 7,619 | 8,407 | 9,229 | 10,314 | 11,126 | 11,632 |
| 2024 | 10,620 | 8,951 | 9,509 | 9,600 | ||||||||
| - = No Data Reported; -- = Not Applicable; NA = Not Available; W = Withheld to avoid disclosure of individual company data. |
| Release Date: 6/28/2024 |
| Next Release Date: 7/31/2024 |
Referring Pages: