|
Download Data (XLS File) |
|
||||||||
|
||||||||
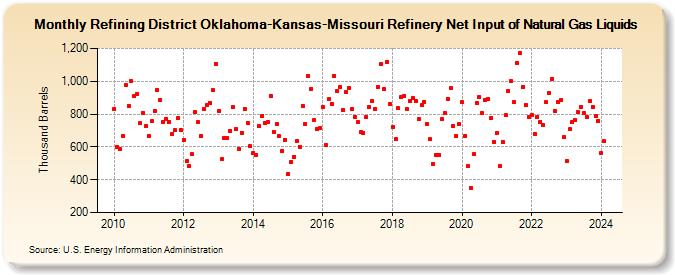
| Refining District Oklahoma-Kansas-Missouri Refinery Net Input of Natural Gas Liquids (Thousand Barrels) | ||||||||
| Year | Jan | Feb | Mar | Apr | May | Jun | Jul | Aug | Sep | Oct | Nov | Dec |
|---|---|---|---|---|---|---|---|---|---|---|---|---|
| 2010 | 830 | 600 | 590 | 668 | 977 | 851 | 1,000 | 909 | 921 | 743 | 809 | 730 |
| 2011 | 669 | 755 | 821 | 947 | 888 | 750 | 770 | 752 | 680 | 701 | 775 | 705 |
| 2012 | 644 | 514 | 485 | 555 | 810 | 750 | 665 | 833 | 854 | 870 | 945 | 1,107 |
| 2013 | 821 | 524 | 656 | 652 | 699 | 843 | 710 | 589 | 687 | 833 | 747 | 603 |
| 2014 | 562 | 553 | 727 | 787 | 747 | 752 | 913 | 693 | 738 | 664 | 578 | 644 |
| 2015 | 434 | 511 | 540 | 634 | 601 | 850 | 739 | 1,031 | 955 | 763 | 707 | 713 |
| 2016 | 842 | 613 | 890 | 864 | 1,034 | 940 | 963 | 825 | 934 | 961 | 832 | 784 |
| 2017 | 749 | 688 | 686 | 783 | 842 | 878 | 832 | 966 | 1,104 | 954 | 1,116 | 862 |
| 2018 | 724 | 647 | 835 | 901 | 911 | 828 | 879 | 897 | 881 | 767 | 855 | 874 |
| 2019 | 738 | 646 | 496 | 552 | 553 | 767 | 805 | 894 | 956 | 726 | 665 | 740 |
| 2020 | 871 | 668 | 482 | 351 | 554 | 870 | 904 | 804 | 884 | 891 | 779 | 632 |
| 2021 | 684 | 482 | 630 | 792 | 942 | 1,001 | 872 | 1,114 | 1,172 | 967 | 855 | 783 |
| 2022 | 795 | 679 | 783 | 752 | 731 | 871 | 926 | 1,014 | 817 | 871 | 885 | 659 |
| 2023 | 517 | 707 | 750 | 764 | 810 | 844 | 806 | 780 | 877 | 845 | 791 | 760 |
| 2024 | 561 | |||||||||||
| - = No Data Reported; -- = Not Applicable; NA = Not Available; W = Withheld to avoid disclosure of individual company data. |
| Release Date: 3/29/2024 |
| Next Release Date: 4/30/2024 |