|
Download Data (XLS File) |
|
||||||||
|
||||||||
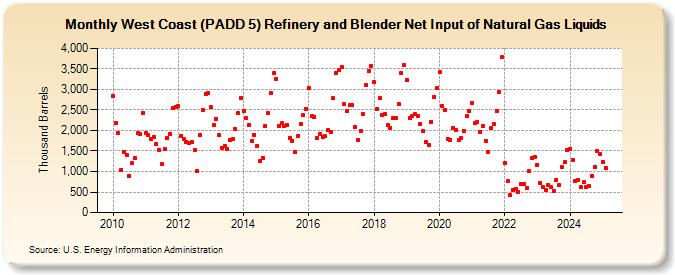
| West Coast (PADD 5) Refinery and Blender Net Input of Natural Gas Liquids (Thousand Barrels) | ||||||||
| Year | Jan | Feb | Mar | Apr | May | Jun | Jul | Aug | Sep | Oct | Nov | Dec |
|---|---|---|---|---|---|---|---|---|---|---|---|---|
| 2010 | 2,831 | 2,185 | 1,931 | 1,044 | 1,473 | 1,403 | 900 | 1,202 | 1,331 | 1,932 | 1,921 | 2,435 |
| 2011 | 1,934 | 1,885 | 1,782 | 1,851 | 1,675 | 1,534 | 1,178 | 1,547 | 1,821 | 1,920 | 2,538 | 2,572 |
| 2012 | 2,587 | 1,869 | 1,794 | 1,726 | 1,689 | 1,719 | 1,515 | 1,010 | 1,882 | 2,511 | 2,900 | 2,906 |
| 2013 | 2,561 | 2,143 | 2,290 | 1,886 | 1,576 | 1,610 | 1,554 | 1,773 | 1,782 | 2,025 | 2,419 | 2,800 |
| 2014 | 2,469 | 2,302 | 2,138 | 1,743 | 1,894 | 1,633 | 1,254 | 1,341 | 2,098 | 2,427 | 2,904 | 3,390 |
| 2015 | 3,253 | 2,111 | 2,171 | 2,110 | 2,127 | 1,823 | 1,750 | 1,479 | 1,873 | 2,154 | 2,377 | 2,532 |
| 2016 | 3,042 | 2,345 | 2,331 | 1,811 | 1,915 | 1,841 | 1,855 | 2,019 | 1,973 | 2,784 | 3,396 | 3,470 |
| 2017 | 3,538 | 2,644 | 2,483 | 2,610 | 2,617 | 2,090 | 1,774 | 1,987 | 2,396 | 3,100 | 3,456 | 3,571 |
| 2018 | 3,180 | 2,516 | 2,780 | 2,365 | 2,401 | 2,136 | 2,064 | 2,308 | 2,294 | 2,640 | 3,390 | 3,595 |
| 2019 | 3,231 | 2,302 | 2,344 | 2,391 | 2,346 | 2,164 | 1,983 | 1,726 | 1,638 | 2,217 | 2,820 | 3,027 |
| 2020 | 3,421 | 2,607 | 2,489 | 1,803 | 1,775 | 2,067 | 2,022 | 1,766 | 1,813 | 1,976 | 2,348 | 2,477 |
| 2021 | 2,658 | 2,171 | 2,214 | 1,967 | 2,098 | 1,755 | 1,474 | 2,060 | 2,169 | 2,463 | 2,927 | 3,788 |
| 2022 | 1,212 | 762 | 418 | 540 | 568 | 496 | 698 | 708 | 589 | 1,004 | 1,320 | 1,354 |
| 2023 | 1,162 | 732 | 632 | 560 | 681 | 622 | 518 | 800 | 663 | 1,105 | 1,220 | 1,518 |
| 2024 | 1,543 | 1,292 | 773 | 792 | ||||||||
| - = No Data Reported; -- = Not Applicable; NA = Not Available; W = Withheld to avoid disclosure of individual company data. |
| Release Date: 6/28/2024 |
| Next Release Date: 7/31/2024 |