|
Download Data (XLS File) |
|
||||||||
|
||||||||
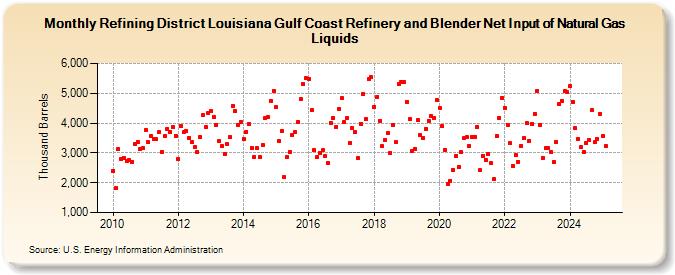
| Refining District Louisiana Gulf Coast Refinery and Blender Net Input of Natural Gas Liquids (Thousand Barrels) | ||||||||
| Year | Jan | Feb | Mar | Apr | May | Jun | Jul | Aug | Sep | Oct | Nov | Dec |
|---|---|---|---|---|---|---|---|---|---|---|---|---|
| 2010 | 2,403 | 1,821 | 3,118 | 2,805 | 2,828 | 2,746 | 2,757 | 2,706 | 3,302 | 3,374 | 3,133 | 3,154 |
| 2011 | 3,774 | 3,357 | 3,560 | 3,462 | 3,451 | 3,698 | 3,040 | 3,556 | 3,809 | 3,716 | 3,872 | 3,577 |
| 2012 | 2,787 | 3,900 | 3,687 | 3,751 | 3,509 | 3,353 | 3,198 | 3,034 | 3,526 | 4,267 | 3,870 | 4,339 |
| 2013 | 4,400 | 4,209 | 3,951 | 3,388 | 3,229 | 2,954 | 3,289 | 3,533 | 4,577 | 4,396 | 3,950 | 4,045 |
| 2014 | 3,461 | 3,716 | 3,974 | 3,160 | 2,868 | 3,149 | 2,857 | 3,281 | 4,174 | 4,208 | 4,747 | 5,093 |
| 2015 | 4,540 | 3,389 | 3,743 | 2,199 | 2,864 | 3,047 | 3,613 | 3,701 | 4,046 | 4,813 | 5,320 | 5,506 |
| 2016 | 5,484 | 4,425 | 3,094 | 2,861 | 3,003 | 3,084 | 2,908 | 2,650 | 4,016 | 4,180 | 3,880 | 4,488 |
| 2017 | 4,826 | 4,042 | 4,160 | 3,345 | 3,820 | 3,702 | 2,820 | 3,987 | 4,975 | 4,124 | 5,475 | 5,534 |
| 2018 | 4,554 | 4,878 | 4,082 | 3,219 | 3,427 | 3,675 | 3,002 | 3,953 | 3,354 | 5,311 | 5,387 | 5,387 |
| 2019 | 4,723 | 4,128 | 3,049 | 3,144 | 4,101 | 3,592 | 3,503 | 3,804 | 4,084 | 4,233 | 4,174 | 4,773 |
| 2020 | 4,508 | 3,887 | 3,093 | 1,947 | 2,070 | 2,429 | 2,886 | 2,532 | 3,030 | 3,490 | 3,525 | 3,235 |
| 2021 | 3,522 | 3,549 | 3,868 | 2,418 | 2,913 | 2,776 | 2,962 | 2,649 | 2,117 | 3,568 | 4,176 | 4,859 |
| 2022 | 4,514 | 3,946 | 3,317 | 2,568 | 2,938 | 2,707 | 3,233 | 3,497 | 3,988 | 3,403 | 3,983 | 4,314 |
| 2023 | 5,081 | 3,937 | 2,833 | 3,165 | 3,153 | 3,037 | 2,705 | 3,375 | 4,626 | 4,752 | 5,071 | 5,032 |
| 2024 | 5,231 | |||||||||||
| - = No Data Reported; -- = Not Applicable; NA = Not Available; W = Withheld to avoid disclosure of individual company data. |
| Release Date: 3/29/2024 |
| Next Release Date: 4/30/2024 |