|
Download Data (XLS File) |
|
||||||||
|
||||||||
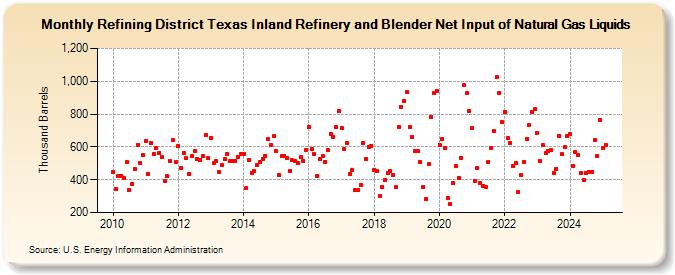
| Refining District Texas Inland Refinery and Blender Net Input of Natural Gas Liquids (Thousand Barrels) | ||||||||
| Year | Jan | Feb | Mar | Apr | May | Jun | Jul | Aug | Sep | Oct | Nov | Dec |
|---|---|---|---|---|---|---|---|---|---|---|---|---|
| 2010 | 445 | 342 | 420 | 425 | 413 | 506 | 337 | 376 | 463 | 610 | 503 | 549 |
| 2011 | 635 | 435 | 623 | 556 | 592 | 562 | 536 | 390 | 421 | 513 | 643 | 506 |
| 2012 | 605 | 474 | 565 | 530 | 435 | 546 | 577 | 524 | 519 | 543 | 675 | 532 |
| 2013 | 653 | 499 | 513 | 445 | 490 | 524 | 559 | 514 | 515 | 513 | 536 | 557 |
| 2014 | 559 | 349 | 518 | 444 | 451 | 491 | 509 | 528 | 542 | 646 | 611 | 666 |
| 2015 | 572 | 426 | 542 | 545 | 531 | 452 | 520 | 514 | 502 | 536 | 512 | 583 |
| 2016 | 724 | 587 | 556 | 425 | 525 | 542 | 510 | 579 | 679 | 660 | 724 | 820 |
| 2017 | 715 | 587 | 624 | 434 | 458 | 335 | 337 | 369 | 623 | 525 | 601 | 607 |
| 2018 | 461 | 454 | 303 | 356 | 398 | 440 | 451 | 430 | 355 | 722 | 843 | 881 |
| 2019 | 932 | 721 | 663 | 573 | 572 | 506 | 357 | 283 | 493 | 783 | 928 | 943 |
| 2020 | 614 | 651 | 592 | 291 | 255 | 379 | 482 | 412 | 535 | 974 | 927 | 819 |
| 2021 | 713 | 395 | 469 | 378 | 364 | 355 | 510 | 595 | 696 | 1,025 | 929 | 750 |
| 2022 | 814 | 653 | 626 | 482 | 499 | 327 | 431 | 508 | 651 | 731 | 811 | 829 |
| 2023 | 682 | 515 | 611 | 562 | 578 | 581 | 440 | 467 | 669 | 554 | 597 | 665 |
| 2024 | 676 | |||||||||||
| - = No Data Reported; -- = Not Applicable; NA = Not Available; W = Withheld to avoid disclosure of individual company data. |
| Release Date: 3/29/2024 |
| Next Release Date: 4/30/2024 |