|
Download Data (XLS File) |
|
||||||||
|
||||||||
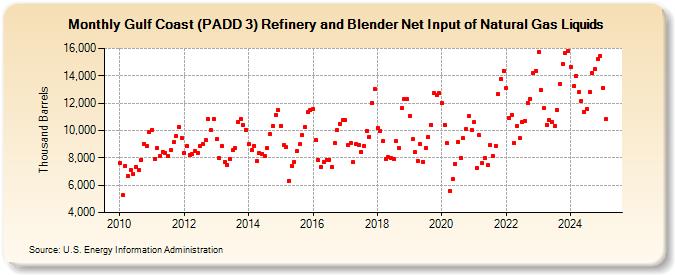
| Gulf Coast (PADD 3) Refinery and Blender Net Input of Natural Gas Liquids (Thousand Barrels) | ||||||||
| Year | Jan | Feb | Mar | Apr | May | Jun | Jul | Aug | Sep | Oct | Nov | Dec |
|---|---|---|---|---|---|---|---|---|---|---|---|---|
| 2010 | 7,604 | 5,258 | 7,434 | 6,649 | 7,093 | 6,821 | 7,336 | 7,144 | 7,869 | 9,034 | 8,848 | 9,885 |
| 2011 | 10,066 | 7,941 | 8,703 | 8,112 | 8,430 | 8,371 | 8,143 | 8,543 | 9,128 | 9,574 | 10,256 | 9,484 |
| 2012 | 8,340 | 8,878 | 8,223 | 8,296 | 8,479 | 8,389 | 8,898 | 8,992 | 9,278 | 10,807 | 10,032 | 10,864 |
| 2013 | 9,344 | 7,973 | 8,849 | 7,702 | 7,471 | 7,906 | 8,546 | 8,711 | 10,642 | 10,853 | 10,413 | 10,066 |
| 2014 | 9,007 | 8,549 | 8,893 | 7,777 | 8,326 | 8,305 | 8,125 | 8,730 | 9,707 | 10,319 | 11,153 | 11,495 |
| 2015 | 10,349 | 8,941 | 8,768 | 6,327 | 7,423 | 7,712 | 8,470 | 8,981 | 9,661 | 10,288 | 11,337 | 11,472 |
| 2016 | 11,545 | 9,292 | 7,839 | 7,341 | 7,696 | 7,867 | 7,869 | 7,333 | 9,049 | 10,016 | 10,491 | 10,731 |
| 2017 | 10,745 | 8,927 | 9,087 | 7,668 | 9,017 | 8,944 | 8,430 | 8,860 | 9,971 | 9,557 | 12,007 | 13,049 |
| 2018 | 10,193 | 9,994 | 9,207 | 7,898 | 8,044 | 8,014 | 7,942 | 9,199 | 8,716 | 11,642 | 12,307 | 12,282 |
| 2019 | 11,089 | 9,341 | 8,397 | 7,752 | 8,980 | 7,730 | 8,728 | 9,527 | 10,426 | 12,722 | 12,581 | 12,714 |
| 2020 | 11,973 | 10,419 | 9,050 | 5,611 | 6,441 | 7,560 | 9,140 | 8,000 | 9,415 | 10,087 | 11,022 | 10,050 |
| 2021 | 10,631 | 7,260 | 9,646 | 7,601 | 8,002 | 7,469 | 8,925 | 8,119 | 8,901 | 12,657 | 13,755 | 14,370 |
| 2022 | 13,082 | 10,895 | 11,165 | 9,069 | 10,298 | 9,463 | 10,600 | 10,720 | 12,018 | 12,287 | 14,235 | 14,370 |
| 2023 | 15,761 | 12,944 | 11,615 | 10,410 | 10,752 | 10,650 | 10,314 | 11,484 | 13,390 | 14,849 | 15,626 | 15,805 |
| 2024 | 14,669 | |||||||||||
| - = No Data Reported; -- = Not Applicable; NA = Not Available; W = Withheld to avoid disclosure of individual company data. |
| Release Date: 3/29/2024 |
| Next Release Date: 4/30/2024 |