|
Download Data (XLS File) |
|
||||||||
|
||||||||
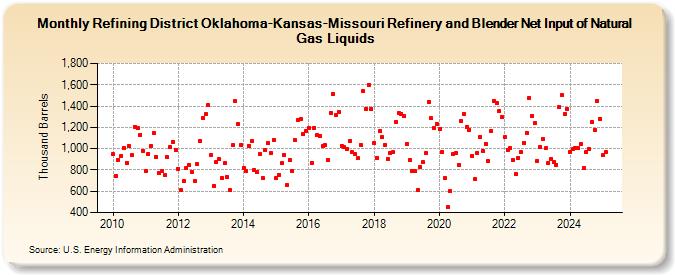
| Refining District Oklahoma-Kansas-Missouri Refinery and Blender Net Input of Natural Gas Liquids (Thousand Barrels) | ||||||||
| Year | Jan | Feb | Mar | Apr | May | Jun | Jul | Aug | Sep | Oct | Nov | Dec |
|---|---|---|---|---|---|---|---|---|---|---|---|---|
| 2010 | 947 | 742 | 894 | 930 | 1,008 | 868 | 1,025 | 938 | 1,208 | 1,191 | 1,133 | 981 |
| 2011 | 791 | 954 | 1,027 | 1,146 | 925 | 773 | 789 | 756 | 919 | 1,018 | 1,063 | 992 |
| 2012 | 812 | 609 | 692 | 816 | 847 | 781 | 693 | 852 | 1,076 | 1,286 | 1,321 | 1,408 |
| 2013 | 945 | 653 | 871 | 899 | 727 | 862 | 733 | 613 | 1,032 | 1,444 | 1,230 | 1,037 |
| 2014 | 821 | 787 | 1,029 | 1,071 | 799 | 783 | 946 | 723 | 986 | 1,053 | 957 | 1,082 |
| 2015 | 721 | 757 | 861 | 945 | 659 | 895 | 788 | 1,077 | 1,273 | 1,275 | 1,140 | 1,166 |
| 2016 | 1,195 | 870 | 1,198 | 1,129 | 1,118 | 1,025 | 1,031 | 895 | 1,337 | 1,518 | 1,317 | 1,345 |
| 2017 | 1,029 | 1,013 | 1,001 | 1,073 | 965 | 950 | 909 | 1,039 | 1,540 | 1,376 | 1,602 | 1,377 |
| 2018 | 1,055 | 911 | 1,162 | 1,109 | 1,038 | 901 | 956 | 966 | 1,251 | 1,334 | 1,328 | 1,311 |
| 2019 | 1,046 | 895 | 787 | 788 | 610 | 830 | 871 | 956 | 1,440 | 1,285 | 1,196 | 1,235 |
| 2020 | 1,184 | 970 | 722 | 449 | 599 | 953 | 957 | 849 | 1,261 | 1,329 | 1,208 | 1,179 |
| 2021 | 934 | 713 | 957 | 1,112 | 981 | 1,048 | 881 | 1,168 | 1,451 | 1,427 | 1,355 | 1,297 |
| 2022 | 1,111 | 983 | 1,006 | 896 | 761 | 916 | 969 | 1,057 | 1,149 | 1,477 | 1,310 | 1,238 |
| 2023 | 888 | 1,017 | 1,094 | 1,003 | 870 | 907 | 874 | 851 | 1,395 | 1,503 | 1,324 | 1,372 |
| 2024 | 970 | |||||||||||
| - = No Data Reported; -- = Not Applicable; NA = Not Available; W = Withheld to avoid disclosure of individual company data. |
| Release Date: 3/29/2024 |
| Next Release Date: 4/30/2024 |