|
Download Data (XLS File) |
|
||||||||
|
||||||||
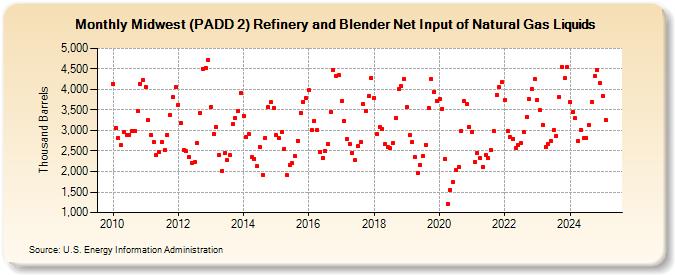
| Midwest (PADD 2) Refinery and Blender Net Input of Natural Gas Liquids (Thousand Barrels) | ||||||||
| Year | Jan | Feb | Mar | Apr | May | Jun | Jul | Aug | Sep | Oct | Nov | Dec |
|---|---|---|---|---|---|---|---|---|---|---|---|---|
| 2010 | 4,140 | 3,067 | 2,814 | 2,645 | 2,960 | 2,882 | 2,897 | 2,986 | 2,982 | 3,482 | 4,135 | 4,233 |
| 2011 | 4,061 | 3,252 | 2,890 | 2,729 | 2,402 | 2,473 | 2,709 | 2,530 | 2,896 | 3,389 | 3,810 | 4,051 |
| 2012 | 3,628 | 3,183 | 2,526 | 2,490 | 2,353 | 2,208 | 2,226 | 2,684 | 3,436 | 4,505 | 4,524 | 4,713 |
| 2013 | 3,578 | 2,911 | 3,075 | 2,411 | 2,020 | 2,445 | 2,276 | 2,391 | 3,146 | 3,306 | 3,482 | 3,918 |
| 2014 | 3,364 | 2,835 | 2,904 | 2,347 | 2,307 | 2,125 | 2,602 | 1,925 | 2,821 | 3,565 | 3,685 | 3,558 |
| 2015 | 2,880 | 2,808 | 2,968 | 2,553 | 1,907 | 2,152 | 2,201 | 2,371 | 2,750 | 3,428 | 3,695 | 3,792 |
| 2016 | 3,974 | 3,021 | 3,239 | 3,006 | 2,484 | 2,341 | 2,500 | 2,663 | 3,450 | 4,483 | 4,335 | 4,342 |
| 2017 | 3,717 | 3,229 | 2,804 | 2,667 | 2,463 | 2,275 | 2,613 | 2,717 | 3,634 | 3,470 | 3,852 | 4,278 |
| 2018 | 3,797 | 2,919 | 3,073 | 3,037 | 2,665 | 2,593 | 2,565 | 2,704 | 3,305 | 3,999 | 4,076 | 4,253 |
| 2019 | 3,567 | 2,885 | 2,709 | 2,343 | 1,962 | 2,170 | 2,372 | 2,655 | 3,549 | 4,250 | 3,944 | 3,718 |
| 2020 | 3,762 | 3,532 | 2,312 | 1,220 | 1,561 | 1,733 | 2,037 | 2,110 | 2,991 | 3,706 | 3,648 | 3,084 |
| 2021 | 2,963 | 2,233 | 2,456 | 2,334 | 2,121 | 2,392 | 2,321 | 2,522 | 2,980 | 3,867 | 4,050 | 4,179 |
| 2022 | 3,733 | 2,983 | 2,840 | 2,799 | 2,572 | 2,637 | 2,689 | 2,968 | 3,321 | 3,764 | 4,016 | 4,246 |
| 2023 | 3,748 | 3,494 | 3,139 | 2,592 | 2,659 | 2,746 | 3,007 | 2,873 | 3,789 | 4,461 | 4,267 | 4,550 |
| 2024 | 3,688 | 3,444 | 3,294 | 2,741 | ||||||||
| - = No Data Reported; -- = Not Applicable; NA = Not Available; W = Withheld to avoid disclosure of individual company data. |
| Release Date: 6/28/2024 |
| Next Release Date: 7/31/2024 |