|
Download Data (XLS File) |
|
||||||||
|
||||||||
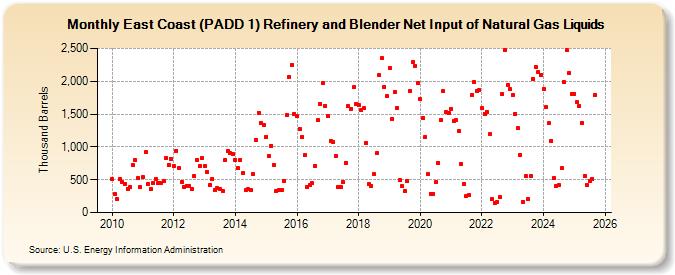
| East Coast (PADD 1) Refinery and Blender Net Input of Natural Gas Liquids (Thousand Barrels) | ||||||||
| Year | Jan | Feb | Mar | Apr | May | Jun | Jul | Aug | Sep | Oct | Nov | Dec |
|---|---|---|---|---|---|---|---|---|---|---|---|---|
| 2010 | 516 | 276 | 210 | 507 | 462 | 442 | 360 | 390 | 726 | 797 | 521 | 393 |
| 2011 | 541 | 924 | 442 | 356 | 456 | 514 | 449 | 455 | 485 | 828 | 729 | 816 |
| 2012 | 707 | 942 | 674 | 465 | 396 | 412 | 404 | 358 | 555 | 808 | 706 | 837 |
| 2013 | 712 | 614 | 423 | 514 | 341 | 373 | 357 | 325 | 798 | 930 | 903 | 893 |
| 2014 | 797 | 676 | 800 | 600 | 342 | 354 | 336 | 583 | 1,111 | 1,523 | 1,364 | 1,335 |
| 2015 | 1,155 | 860 | 1,021 | 725 | 328 | 342 | 337 | 484 | 1,487 | 2,064 | 2,252 | 1,503 |
| 2016 | 1,464 | 1,271 | 1,154 | 877 | 391 | 421 | 446 | 710 | 1,412 | 1,657 | 1,977 | 1,623 |
| 2017 | 1,466 | 1,090 | 1,071 | 861 | 392 | 383 | 464 | 759 | 1,618 | 1,578 | 1,908 | 1,658 |
| 2018 | 1,640 | 1,566 | 1,588 | 1,056 | 434 | 406 | 580 | 902 | 2,093 | 2,348 | 1,918 | 1,770 |
| 2019 | 2,202 | 1,423 | 1,843 | 1,591 | 489 | 408 | 327 | 485 | 1,854 | 2,287 | 2,235 | 1,972 |
| 2020 | 1,722 | 1,446 | 1,147 | 583 | 290 | 289 | 468 | 760 | 1,413 | 1,851 | 1,535 | 1,510 |
| 2021 | 1,581 | 1,398 | 1,409 | 1,244 | 745 | 440 | 249 | 266 | 1,789 | 1,989 | 1,857 | 1,863 |
| 2022 | 1,585 | 1,505 | 1,534 | 1,192 | 201 | 152 | 163 | 232 | 1,805 | 2,471 | 1,949 | 1,880 |
| 2023 | 1,793 | 1,508 | 1,277 | 878 | 165 | 551 | 201 | 560 | 2,012 | 2,176 | 2,109 | 2,099 |
| 2024 | 1,884 | |||||||||||
| - = No Data Reported; -- = Not Applicable; NA = Not Available; W = Withheld to avoid disclosure of individual company data. |
| Release Date: 3/29/2024 |
| Next Release Date: 4/30/2024 |