|
Download Data (XLS File) |
|
||||||||
|
||||||||
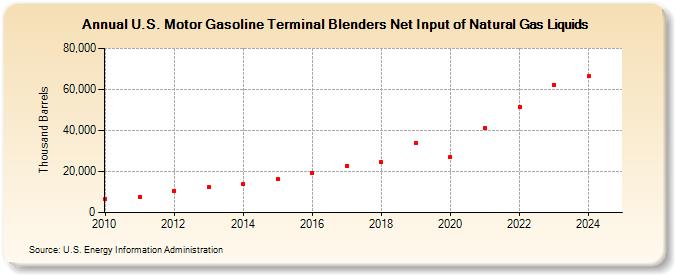
| U.S. Motor Gasoline Terminal Blenders Net Input of Natural Gas Liquids (Thousand Barrels) | ||||||||
| Decade | Year-0 | Year-1 | Year-2 | Year-3 | Year-4 | Year-5 | Year-6 | Year-7 | Year-8 | Year-9 |
|---|---|---|---|---|---|---|---|---|---|---|
| 2010's | 6,538 | 7,810 | 10,663 | 12,304 | 14,038 | 16,322 | 19,301 | 22,678 | 24,490 | 33,817 |
| 2020's | 27,161 | 41,390 | 51,483 | 62,174 |
| - = No Data Reported; -- = Not Applicable; NA = Not Available; W = Withheld to avoid disclosure of individual company data. |
| Release Date: 3/29/2024 |
| Next Release Date: 8/30/2024 |
Referring Pages: