|
Download Data (XLS File) |
|
||||||||
|
||||||||
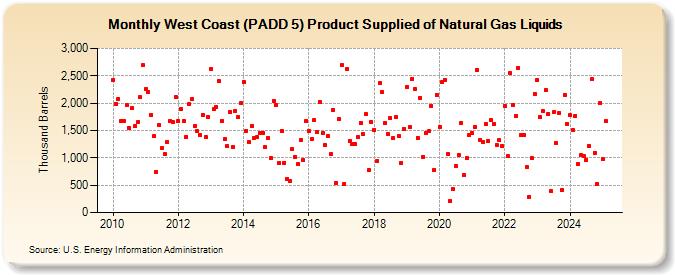
| West Coast (PADD 5) Product Supplied of Natural Gas Liquids (Thousand Barrels) | ||||||||
| Year | Jan | Feb | Mar | Apr | May | Jun | Jul | Aug | Sep | Oct | Nov | Dec |
|---|---|---|---|---|---|---|---|---|---|---|---|---|
| 2010 | 2,425 | 1,992 | 2,084 | 1,677 | 1,669 | 1,966 | 1,546 | 1,906 | 1,581 | 1,649 | 2,105 | 2,688 |
| 2011 | 2,258 | 2,201 | 1,789 | 1,395 | 748 | 1,600 | 1,174 | 1,064 | 1,293 | 1,675 | 1,659 | 2,116 |
| 2012 | 1,670 | 1,897 | 1,678 | 1,381 | 1,981 | 2,081 | 1,576 | 1,485 | 1,414 | 1,790 | 1,382 | 1,753 |
| 2013 | 2,626 | 1,890 | 1,927 | 2,398 | 1,680 | 1,338 | 1,209 | 1,845 | 1,197 | 1,860 | 1,748 | 1,995 |
| 2014 | 2,392 | 1,499 | 1,288 | 1,588 | 1,369 | 1,378 | 1,453 | 1,457 | 1,191 | 1,359 | 990 | 2,042 |
| 2015 | 1,968 | 905 | 1,499 | 907 | 621 | 573 | 1,154 | 1,016 | 880 | 1,333 | 955 | 1,676 |
| 2016 | 1,497 | 1,350 | 1,687 | 1,475 | 2,027 | 1,451 | 1,233 | 1,398 | 1,065 | 1,874 | 549 | 1,711 |
| 2017 | 2,692 | 528 | 2,622 | 1,307 | 1,251 | 1,258 | 1,378 | 1,637 | 1,429 | 1,793 | 776 | 1,651 |
| 2018 | 1,517 | 939 | 2,370 | 2,203 | 1,630 | 1,439 | 1,724 | 1,362 | 1,738 | 1,397 | 906 | 1,535 |
| 2019 | 2,302 | 1,563 | 2,446 | 2,260 | 1,369 | 2,093 | 1,021 | 1,451 | 1,482 | 1,951 | 779 | 2,155 |
| 2020 | 1,566 | 2,390 | 2,429 | 1,074 | 215 | 425 | 853 | 1,053 | 1,644 | 686 | 996 | 1,417 |
| 2021 | 1,455 | 1,564 | 2,612 | 1,331 | 1,286 | 1,612 | 1,316 | 1,686 | 1,622 | 1,235 | 1,322 | 1,214 |
| 2022 | 1,949 | 1,031 | 2,542 | 1,964 | 1,773 | 2,646 | 1,421 | 1,420 | 835 | 289 | 995 | 2,175 |
| 2023 | 2,410 | 1,724 | 1,902 | 1,710 | 2,316 | 388 | 1,827 | 1,271 | 1,656 | 567 | 2,115 | 1,606 |
| 2024 | 1,782 | 1,510 | 1,772 | 866 | ||||||||
| - = No Data Reported; -- = Not Applicable; NA = Not Available; W = Withheld to avoid disclosure of individual company data. |
| Release Date: 6/28/2024 |
| Next Release Date: 7/31/2024 |