|
Download Data (XLS File) |
|
||||||||
|
||||||||
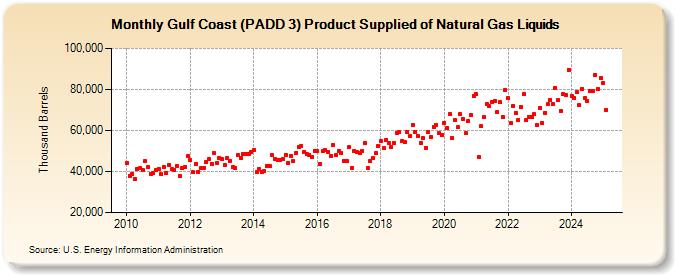
| Gulf Coast (PADD 3) Product Supplied of Natural Gas Liquids (Thousand Barrels) | ||||||||
| Year | Jan | Feb | Mar | Apr | May | Jun | Jul | Aug | Sep | Oct | Nov | Dec |
|---|---|---|---|---|---|---|---|---|---|---|---|---|
| 2010 | 44,374 | 38,034 | 38,757 | 36,267 | 41,347 | 41,550 | 40,521 | 44,947 | 42,011 | 38,981 | 39,051 | 40,766 |
| 2011 | 41,122 | 38,624 | 42,265 | 39,420 | 43,090 | 40,987 | 40,960 | 42,713 | 37,975 | 41,707 | 42,151 | 47,499 |
| 2012 | 45,593 | 39,549 | 43,499 | 39,774 | 41,776 | 41,781 | 44,499 | 45,860 | 43,856 | 48,997 | 44,337 | 46,746 |
| 2013 | 45,958 | 43,396 | 46,603 | 45,346 | 42,004 | 41,739 | 47,851 | 46,728 | 48,520 | 48,428 | 48,593 | 49,630 |
| 2014 | 50,703 | 39,833 | 41,337 | 39,915 | 40,173 | 42,535 | 42,724 | 47,911 | 46,290 | 45,376 | 45,561 | 46,074 |
| 2015 | 48,132 | 44,232 | 47,692 | 45,058 | 49,213 | 52,017 | 52,264 | 49,593 | 48,318 | 48,086 | 47,049 | 50,125 |
| 2016 | 49,817 | 43,683 | 49,854 | 50,727 | 49,718 | 47,726 | 52,910 | 47,971 | 50,127 | 48,823 | 45,302 | 44,903 |
| 2017 | 51,881 | 41,955 | 50,193 | 49,449 | 48,829 | 49,956 | 53,887 | 41,516 | 45,310 | 46,398 | 48,867 | 52,257 |
| 2018 | 54,803 | 51,664 | 55,442 | 53,720 | 51,911 | 53,971 | 58,685 | 59,206 | 54,930 | 54,599 | 59,284 | 57,209 |
| 2019 | 62,676 | 59,221 | 57,461 | 53,887 | 56,145 | 51,482 | 59,383 | 56,870 | 61,601 | 62,646 | 58,745 | 57,870 |
| 2020 | 63,756 | 61,181 | 67,959 | 56,546 | 65,193 | 61,559 | 67,816 | 65,592 | 58,763 | 64,720 | 67,400 | 76,934 |
| 2021 | 77,639 | 46,859 | 61,980 | 66,534 | 72,899 | 71,768 | 74,001 | 74,432 | 68,962 | 73,752 | 66,490 | 79,752 |
| 2022 | 75,759 | 63,848 | 72,129 | 68,726 | 65,141 | 71,410 | 77,820 | 64,898 | 66,779 | 66,602 | 67,885 | 62,485 |
| 2023 | 66,349 | 58,331 | 68,039 | 71,511 | 74,718 | 75,285 | 79,296 | 72,787 | 67,048 | 79,068 | 76,132 | 86,345 |
| 2024 | 76,860 | |||||||||||
| - = No Data Reported; -- = Not Applicable; NA = Not Available; W = Withheld to avoid disclosure of individual company data. |
| Release Date: 3/29/2024 |
| Next Release Date: 4/30/2024 |