|
Download Data (XLS File) |
|
||||||||
|
||||||||
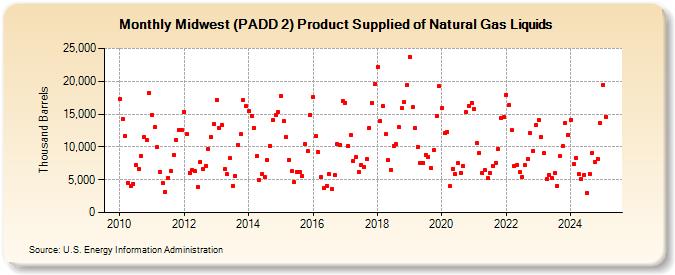
| Midwest (PADD 2) Product Supplied of Natural Gas Liquids (Thousand Barrels) | ||||||||
| Year | Jan | Feb | Mar | Apr | May | Jun | Jul | Aug | Sep | Oct | Nov | Dec |
|---|---|---|---|---|---|---|---|---|---|---|---|---|
| 2010 | 17,251 | 14,234 | 11,669 | 4,567 | 3,994 | 4,419 | 7,305 | 6,565 | 8,627 | 11,551 | 11,097 | 18,245 |
| 2011 | 14,920 | 12,966 | 9,914 | 6,223 | 4,507 | 3,162 | 5,335 | 6,398 | 8,813 | 11,097 | 12,554 | 12,565 |
| 2012 | 15,384 | 11,973 | 6,097 | 6,483 | 6,266 | 3,950 | 7,714 | 6,558 | 7,147 | 9,698 | 11,532 | 13,466 |
| 2013 | 17,163 | 12,913 | 13,348 | 6,598 | 5,801 | 8,270 | 4,095 | 5,611 | 10,329 | 11,909 | 17,169 | 16,154 |
| 2014 | 15,398 | 14,670 | 12,940 | 8,578 | 4,954 | 5,888 | 5,393 | 8,041 | 10,166 | 14,032 | 14,812 | 15,343 |
| 2015 | 17,787 | 13,892 | 11,535 | 8,048 | 6,265 | 4,600 | 6,246 | 6,216 | 5,530 | 10,436 | 9,355 | 14,920 |
| 2016 | 17,582 | 11,614 | 9,195 | 5,407 | 3,703 | 4,101 | 5,856 | 3,624 | 5,697 | 10,365 | 10,322 | 16,985 |
| 2017 | 16,760 | 10,143 | 11,841 | 7,884 | 8,421 | 6,140 | 7,237 | 7,009 | 8,119 | 12,945 | 16,722 | 19,555 |
| 2018 | 22,217 | 13,931 | 16,219 | 11,909 | 7,985 | 6,530 | 10,170 | 10,395 | 12,968 | 15,867 | 16,886 | 19,462 |
| 2019 | 23,761 | 16,030 | 12,902 | 10,010 | 7,603 | 7,602 | 8,816 | 8,431 | 6,794 | 9,525 | 14,715 | 19,215 |
| 2020 | 15,912 | 12,045 | 12,239 | 3,987 | 6,676 | 5,812 | 7,523 | 6,084 | 7,053 | 15,309 | 16,253 | 16,704 |
| 2021 | 15,818 | 10,538 | 9,090 | 6,024 | 6,444 | 5,199 | 6,031 | 7,095 | 7,597 | 9,715 | 14,403 | 14,536 |
| 2022 | 17,948 | 16,358 | 12,542 | 7,068 | 7,289 | 6,111 | 5,439 | 7,173 | 8,105 | 12,086 | 9,351 | 13,288 |
| 2023 | 14,188 | 11,244 | 10,184 | 5,829 | 5,933 | 6,182 | 6,083 | 4,560 | 8,785 | 10,063 | 13,744 | 13,168 |
| 2024 | 14,749 | |||||||||||
| - = No Data Reported; -- = Not Applicable; NA = Not Available; W = Withheld to avoid disclosure of individual company data. |
| Release Date: 3/29/2024 |
| Next Release Date: 4/30/2024 |