|
Download Data (XLS File) |
|
||||||||
|
||||||||
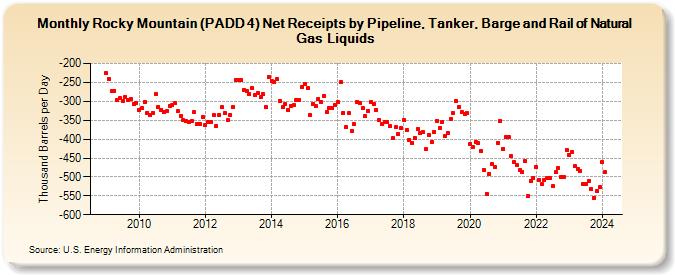
| Rocky Mountain (PADD 4) Net Receipts by Pipeline, Tanker, Barge and Rail of Natural Gas Liquids (Thousand Barrels per Day) | ||||||||
| Year | Jan | Feb | Mar | Apr | May | Jun | Jul | Aug | Sep | Oct | Nov | Dec |
|---|---|---|---|---|---|---|---|---|---|---|---|---|
| 2009 | -226 | -241 | -274 | -272 | -296 | -291 | -299 | -288 | -297 | -295 | -307 | -304 |
| 2010 | -323 | -319 | -302 | -330 | -337 | -330 | -282 | -315 | -322 | -328 | -326 | -312 |
| 2011 | -310 | -304 | -326 | -338 | -350 | -352 | -356 | -352 | -329 | -360 | -359 | -341 |
| 2012 | -364 | -355 | -355 | -337 | -366 | -336 | -316 | -331 | -350 | -336 | -316 | -243 |
| 2013 | -243 | -244 | -269 | -273 | -280 | -265 | -284 | -279 | -289 | -282 | -316 | -236 |
| 2014 | -246 | -249 | -242 | -299 | -316 | -306 | -322 | -312 | -311 | -296 | -296 | -262 |
| 2015 | -254 | -265 | -336 | -306 | -313 | -295 | -301 | -286 | -328 | -318 | -317 | -311 |
| 2016 | -302 | -250 | -330 | -369 | -332 | -378 | -360 | -301 | -304 | -318 | -340 | -325 |
| 2017 | -301 | -307 | -323 | -349 | -360 | -356 | -354 | -365 | -398 | -369 | -387 | -371 |
| 2018 | -350 | -377 | -402 | -409 | -396 | -373 | -384 | -382 | -427 | -388 | -408 | -381 |
| 2019 | -351 | -370 | -355 | -393 | -385 | -347 | -332 | -300 | -315 | -329 | -334 | -332 |
| 2020 | -413 | -421 | -407 | -411 | -431 | -481 | -544 | -491 | -466 | -474 | -409 | -352 |
| 2021 | -426 | -395 | -395 | -446 | -461 | -468 | -482 | -487 | -459 | -551 | -511 | -502 |
| 2022 | -475 | -508 | -520 | -508 | -502 | -504 | -525 | -488 | -476 | -500 | -500 | -429 |
| 2023 | -442 | -433 | -472 | -478 | -484 | -518 | -520 | -512 | -533 | -555 | -538 | -528 |
| 2024 | -461 | |||||||||||
| - = No Data Reported; -- = Not Applicable; NA = Not Available; W = Withheld to avoid disclosure of individual company data. |
| Release Date: 3/29/2024 |
| Next Release Date: 4/30/2024 |