|
Download Data (XLS File) |
|
||||||||
|
||||||||
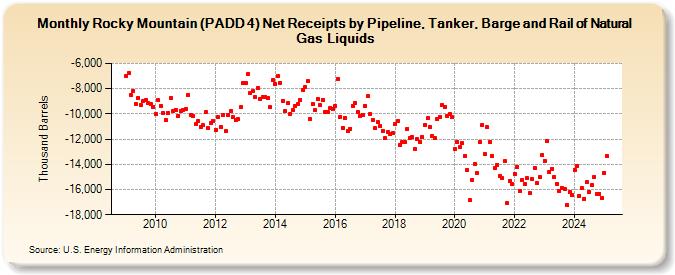
| Rocky Mountain (PADD 4) Net Receipts by Pipeline, Tanker, Barge and Rail of Natural Gas Liquids (Thousand Barrels) | ||||||||
| Year | Jan | Feb | Mar | Apr | May | Jun | Jul | Aug | Sep | Oct | Nov | Dec |
|---|---|---|---|---|---|---|---|---|---|---|---|---|
| 2009 | -7,000 | -6,761 | -8,500 | -8,166 | -9,181 | -8,722 | -9,265 | -8,940 | -8,901 | -9,136 | -9,211 | -9,425 |
| 2010 | -10,016 | -8,922 | -9,353 | -9,897 | -10,454 | -9,903 | -8,735 | -9,773 | -9,656 | -10,171 | -9,781 | -9,668 |
| 2011 | -9,602 | -8,504 | -10,115 | -10,151 | -10,836 | -10,547 | -11,039 | -10,909 | -9,882 | -11,155 | -10,759 | -10,577 |
| 2012 | -11,274 | -10,283 | -11,001 | -10,110 | -11,361 | -10,068 | -9,794 | -10,250 | -10,490 | -10,426 | -9,491 | -7,544 |
| 2013 | -7,542 | -6,833 | -8,332 | -8,185 | -8,695 | -7,937 | -8,816 | -8,637 | -8,655 | -8,728 | -9,467 | -7,326 |
| 2014 | -7,611 | -6,969 | -7,511 | -8,962 | -9,785 | -9,167 | -9,973 | -9,684 | -9,338 | -9,178 | -8,890 | -8,121 |
| 2015 | -7,882 | -7,429 | -10,403 | -9,186 | -9,695 | -8,838 | -9,317 | -8,873 | -9,835 | -9,852 | -9,522 | -9,633 |
| 2016 | -9,359 | -7,249 | -10,224 | -11,084 | -10,288 | -11,342 | -11,164 | -9,339 | -9,107 | -9,847 | -10,192 | -10,064 |
| 2017 | -9,339 | -8,602 | -10,020 | -10,460 | -11,149 | -10,665 | -10,969 | -11,322 | -11,938 | -11,424 | -11,610 | -11,516 |
| 2018 | -10,835 | -10,556 | -12,471 | -12,267 | -12,266 | -11,177 | -11,900 | -11,844 | -12,820 | -12,022 | -12,230 | -11,820 |
| 2019 | -10,890 | -10,364 | -11,004 | -11,785 | -11,922 | -10,416 | -10,282 | -9,311 | -9,443 | -10,186 | -10,016 | -10,277 |
| 2020 | -12,815 | -12,222 | -12,625 | -12,344 | -13,355 | -14,438 | -16,866 | -15,212 | -13,974 | -14,692 | -12,255 | -10,899 |
| 2021 | -13,211 | -11,066 | -12,238 | -13,378 | -14,302 | -14,029 | -14,946 | -15,089 | -13,759 | -17,079 | -15,316 | -15,562 |
| 2022 | -14,740 | -14,226 | -16,111 | -15,254 | -15,576 | -15,121 | -16,283 | -15,132 | -14,285 | -15,510 | -15,013 | -13,287 |
| 2023 | -13,701 | -12,137 | -14,618 | -14,342 | -15,013 | -15,542 | -16,119 | -15,864 | -15,984 | -17,209 | -16,134 | -16,373 |
| 2024 | -14,277 | |||||||||||
| - = No Data Reported; -- = Not Applicable; NA = Not Available; W = Withheld to avoid disclosure of individual company data. |
| Release Date: 3/29/2024 |
| Next Release Date: 4/30/2024 |